Is It Time To Reconsider ACADIA Pharmaceuticals (ACAD) After Strong One Year Share Price Gain?
ACADIA Pharmaceuticals Inc. ACAD | 22.20 | -0.54% |
- If you are trying to figure out whether ACADIA Pharmaceuticals is priced attractively right now, you are in the right place.
- The stock recently closed at US$26.13, with returns of 41.2% over 1 year, 31.6% over 3 years and a 49.0% decline over 5 years. Shorter term moves of 2.7% over 7 days and 0.6% over 30 days show a quieter near term picture.
- Recent news around ACADIA has focused on its position within the pharmaceuticals and biotech space and investor interest in how its product pipeline and approvals feed into long term expectations. This context helps explain why the share price record over 1, 3 and 5 years has drawn attention from investors weighing up both growth potential and changing views on risk.
- On our valuation checks, ACADIA scores 5 out of 6. This puts the stock in focus for a closer look at different valuation methods, and later in the article we will talk about an even more rounded way to think about what that score really means.
Approach 1: ACADIA Pharmaceuticals Discounted Cash Flow (DCF) Analysis
A Discounted Cash Flow, or DCF, model takes projected future cash flows, discounts them back to today using a required return, and adds them up to estimate what the business might be worth right now.
For ACADIA Pharmaceuticals, the model used is a 2 Stage Free Cash Flow to Equity approach. The company’s latest twelve month free cash flow is about $142.7 million. Analysts have provided free cash flow estimates out to 2030, and Simply Wall St extrapolates beyond the initial analyst horizon to build a 10 year path of cash flows in dollars.
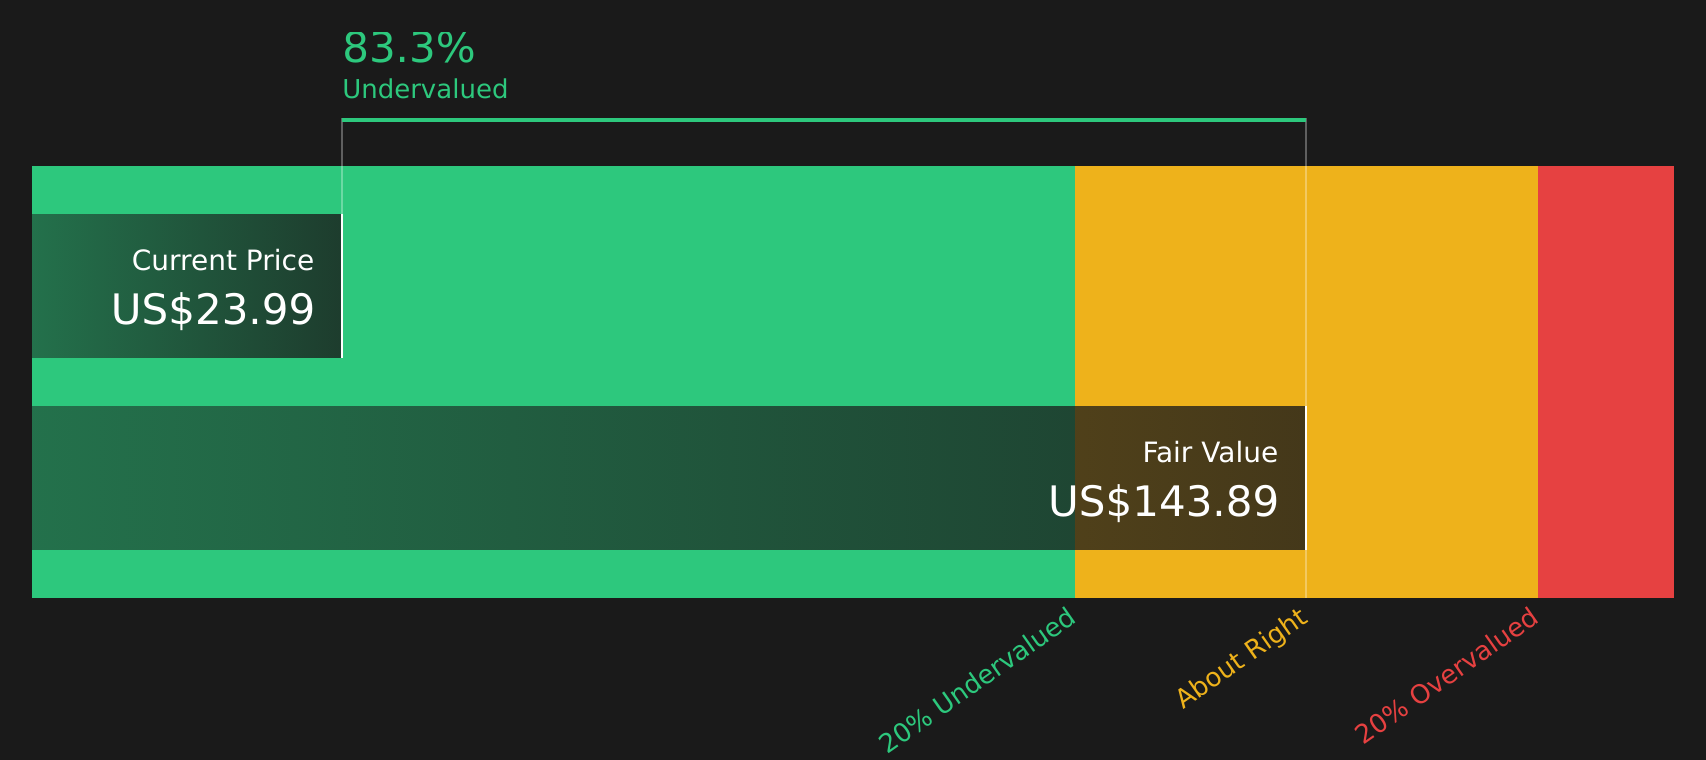
Within those projections, free cash flow in 2030 is set at $780.0 million, with intermediate years such as 2026 at $249.6 million and 2028 at $417.9 million, all discounted back to today. When all discounted cash flows are added together, the DCF model produces an estimated intrinsic value of about $140.47 per share.
Compared with the recent share price of US$26.13, this DCF output suggests the stock is 81.4% undervalued on this set of assumptions.
Result: UNDERVALUED
Our Discounted Cash Flow (DCF) analysis suggests ACADIA Pharmaceuticals is undervalued by 81.4%. Track this in your watchlist or portfolio, or discover 876 more undervalued stocks based on cash flows.
Approach 2: ACADIA Pharmaceuticals Price vs Earnings
For profitable companies, the P/E ratio is a common way to think about what you are paying for each dollar of earnings. It links the share price to the underlying profit, which is usually a core driver of long term value.
What counts as a “normal” P/E often reflects how the market sees a company’s growth potential and risk. Higher expected growth or lower perceived risk can justify a higher multiple, while slower growth or higher risk tends to line up with a lower multiple.
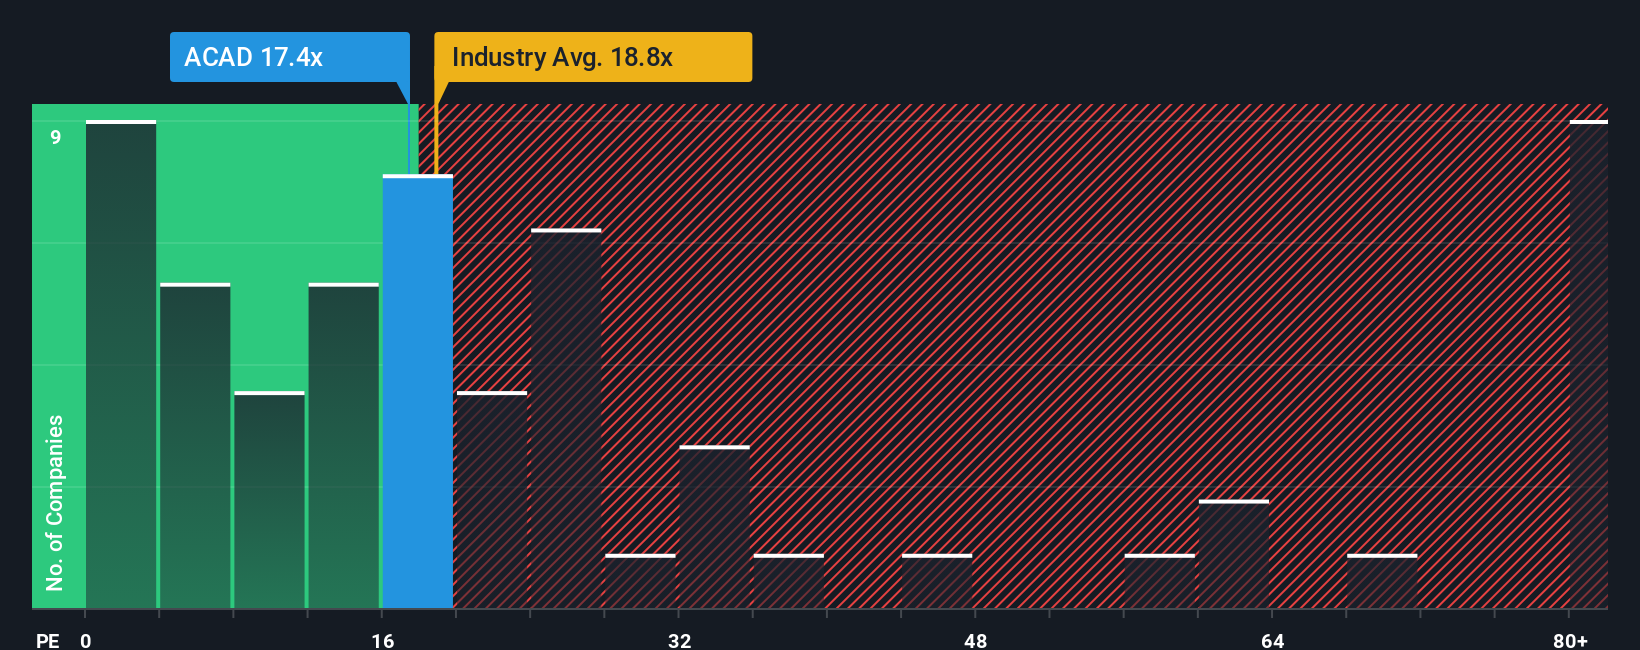
ACADIA Pharmaceuticals currently trades on a P/E of 16.93x. That is below the Biotechs industry average P/E of about 20.64x and below the peer group average of 35.38x. Simply Wall St’s Fair Ratio for ACADIA, which is 22.23x, is a proprietary estimate of what the P/E might be given factors such as earnings growth, industry, profit margins, market cap and company specific risks.
This Fair Ratio is more tailored than a simple peer or industry comparison because it adjusts for those business specific drivers rather than treating all companies as if they were the same. Comparing the Fair Ratio of 22.23x with the current P/E of 16.93x indicates that the shares are trading below that modelled level.
Result: UNDERVALUED
P/E ratios tell one story, but what if the real opportunity lies elsewhere? Discover 1424 companies where insiders are betting big on explosive growth.
Upgrade Your Decision Making: Choose your ACADIA Pharmaceuticals Narrative
Earlier we mentioned that there is an even better way to think about valuation, so let us introduce Narratives, which let you attach a clear story about ACADIA Pharmaceuticals to the numbers you are using for fair value, future revenue, earnings and margins.
A Narrative is simply your view of what is going on at the company, written out as a short story, then translated into a financial forecast that links assumptions about the business to an estimated fair value per share.
On Simply Wall St, Narratives sit inside the Community page and are designed to be easy to use, so you can quickly compare your own view of ACADIA Pharmaceuticals with those of millions of other investors who use the platform.
Each Narrative helps you decide what to do by setting out a Fair Value and then comparing it to today’s share price. Because the inputs are refreshed when new information such as earnings releases or news is added, those Narratives stay current without you having to rebuild everything from scratch.
For example, one ACADIA Pharmaceuticals Narrative might assume a relatively high fair value based on stronger revenue growth and margins, while another might use more cautious assumptions and arrive at a much lower fair value. You can see both side by side before making your own call.
Do you think there's more to the story for ACADIA Pharmaceuticals? Head over to our Community to see what others are saying!

This article by Simply Wall St is general in nature. We provide commentary based on historical data and analyst forecasts only using an unbiased methodology and our articles are not intended to be financial advice. It does not constitute a recommendation to buy or sell any stock, and does not take account of your objectives, or your financial situation. We aim to bring you long-term focused analysis driven by fundamental data. Note that our analysis may not factor in the latest price-sensitive company announcements or qualitative material. Simply Wall St has no position in any stocks mentioned.