Is It Time To Reconsider American Tower (AMT) After A 14% One-Year Share Price Decline
American Tower Corporation AMT | 0.00 |
- If you are wondering whether American Tower's current share price reflects its true worth, you are not alone. This article focuses squarely on what the numbers say about valuation.
- The stock recently closed at US$176.31, with returns of 0.9% year to date but a 14.0% decline over the last year and a 2.4% decline over three years, which may have some investors reassessing both upside potential and risk.
- Recent coverage has focused on American Tower's role as a specialized REIT and how changing sentiment around real estate, interest rates, and demand for communications infrastructure may be influencing pricing. Those themes help explain why the share price has not moved much over the last 7 and 30 days, yet remains lower over the one and five year periods.
- Simply Wall St's valuation model currently gives American Tower a 5 out of 6 valuation score. Next is a closer look at how different valuation approaches arrive at that result and how a more holistic view can give you an even clearer picture by the end of this article.
Approach 1: American Tower Discounted Cash Flow (DCF) Analysis
A Discounted Cash Flow, or DCF, model estimates what a company might be worth by projecting its future adjusted funds from operations and then discounting those cash flows back to today’s value. It is essentially asking what the stream of future cash a business could generate is worth in today’s dollars.
For American Tower, the model uses last twelve months free cash flow of about $5.0b as a starting point. Analysts provide estimates for several years ahead, and Simply Wall St extends those projections further. By 2030, projected free cash flow is $6.6b, with a ten year path that is a mix of analyst inputs and extrapolated figures based on those inputs.
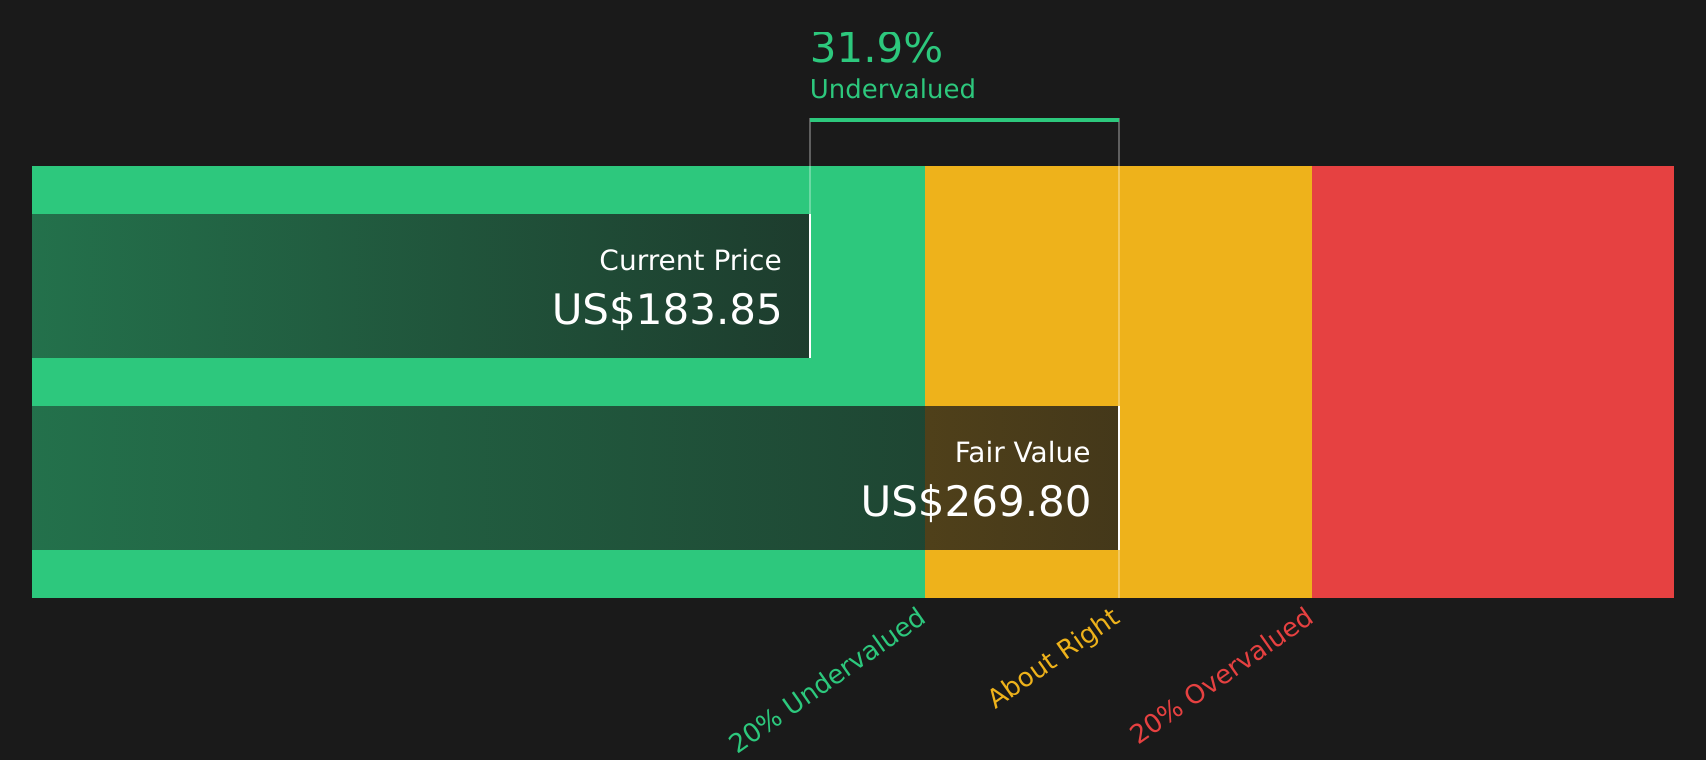
When all those future $ cash flows are discounted back, the DCF model arrives at an estimated intrinsic value of $263.19 per share. Against the recent share price of $176.31, this implies a 33.0% discount, which suggests the shares are currently priced below this cash flow based estimate of value.
Result: UNDERVALUED
Our Discounted Cash Flow (DCF) analysis suggests American Tower is undervalued by 33.0%. Track this in your watchlist or portfolio, or discover 61 more high quality undervalued stocks.
Approach 2: American Tower Price vs Earnings
For profitable companies, the P/E ratio is a useful shorthand for what you are paying for each dollar of earnings. It links the share price directly to current earnings and lets you compare that price tag with other businesses that also generate profits.
What counts as a “normal” or “fair” P/E ratio depends a lot on expectations and risk. Higher expected earnings growth or a perception of lower risk can support a higher P/E, while slower growth or higher perceived risk usually lines up with a lower P/E.
American Tower currently trades on a P/E of 32.51x. That sits above the Specialized REITs industry average P/E of 16.41x, yet below the peer average of 47.79x. Simply Wall St also calculates a “Fair Ratio” of 32.64x, which is the P/E level suggested by factors such as earnings growth, profit margins, industry, market cap and key risks. This Fair Ratio gives a more tailored benchmark than broad industry or peer comparisons because it attempts to line up the multiple with the company’s own characteristics rather than generic group averages.
With the current P/E of 32.51x sitting very close to the Fair Ratio of 32.64x, the shares look ABOUT RIGHT on this metric.
Result: ABOUT RIGHT

P/E ratios tell one story, but what if the real opportunity lies elsewhere? Start investing in legacies, not executives. Discover our 19 top founder-led companies.
Upgrade Your Decision Making: Choose your American Tower Narrative
Earlier it was mentioned that there is an even better way to understand valuation, so meet Narratives, a simple tool that lets you write the story behind your numbers by linking your view on American Tower’s future revenue, earnings and margins to a forecast and then to your own fair value estimate.
On Simply Wall St’s Community page, Narratives are easy to use. You set your assumptions, see how they roll through to a financial forecast, then compare your Fair Value to today’s Price to help decide whether the stock currently looks attractive, fairly priced or expensive to you.
Because Narratives update automatically when new information such as earnings releases or major news is added to the platform, your fair value view can stay aligned with what is happening with the company without you rebuilding a model each time.
For American Tower, one investor might build a Narrative that assumes relatively cautious growth and arrives at a lower fair value, while another might assume stronger fundamentals and see a much higher fair value. You can view that full range of Narratives in the Community and decide which story most closely fits your own thinking.
Do you think there's more to the story for American Tower? Head over to our Community to see what others are saying!

This article by Simply Wall St is general in nature. We provide commentary based on historical data and analyst forecasts only using an unbiased methodology and our articles are not intended to be financial advice. It does not constitute a recommendation to buy or sell any stock, and does not take account of your objectives, or your financial situation. We aim to bring you long-term focused analysis driven by fundamental data. Note that our analysis may not factor in the latest price-sensitive company announcements or qualitative material. Simply Wall St has no position in any stocks mentioned.