Is It Time To Reconsider Fortinet (FTNT) After Recent Share Price Pullback?
Fortinet, Inc. FTNT | 82.53 | +1.70% |
- If you are wondering whether Fortinet's current share price lines up with what the business might be worth, you are not alone. This article is designed to help you frame that question clearly.
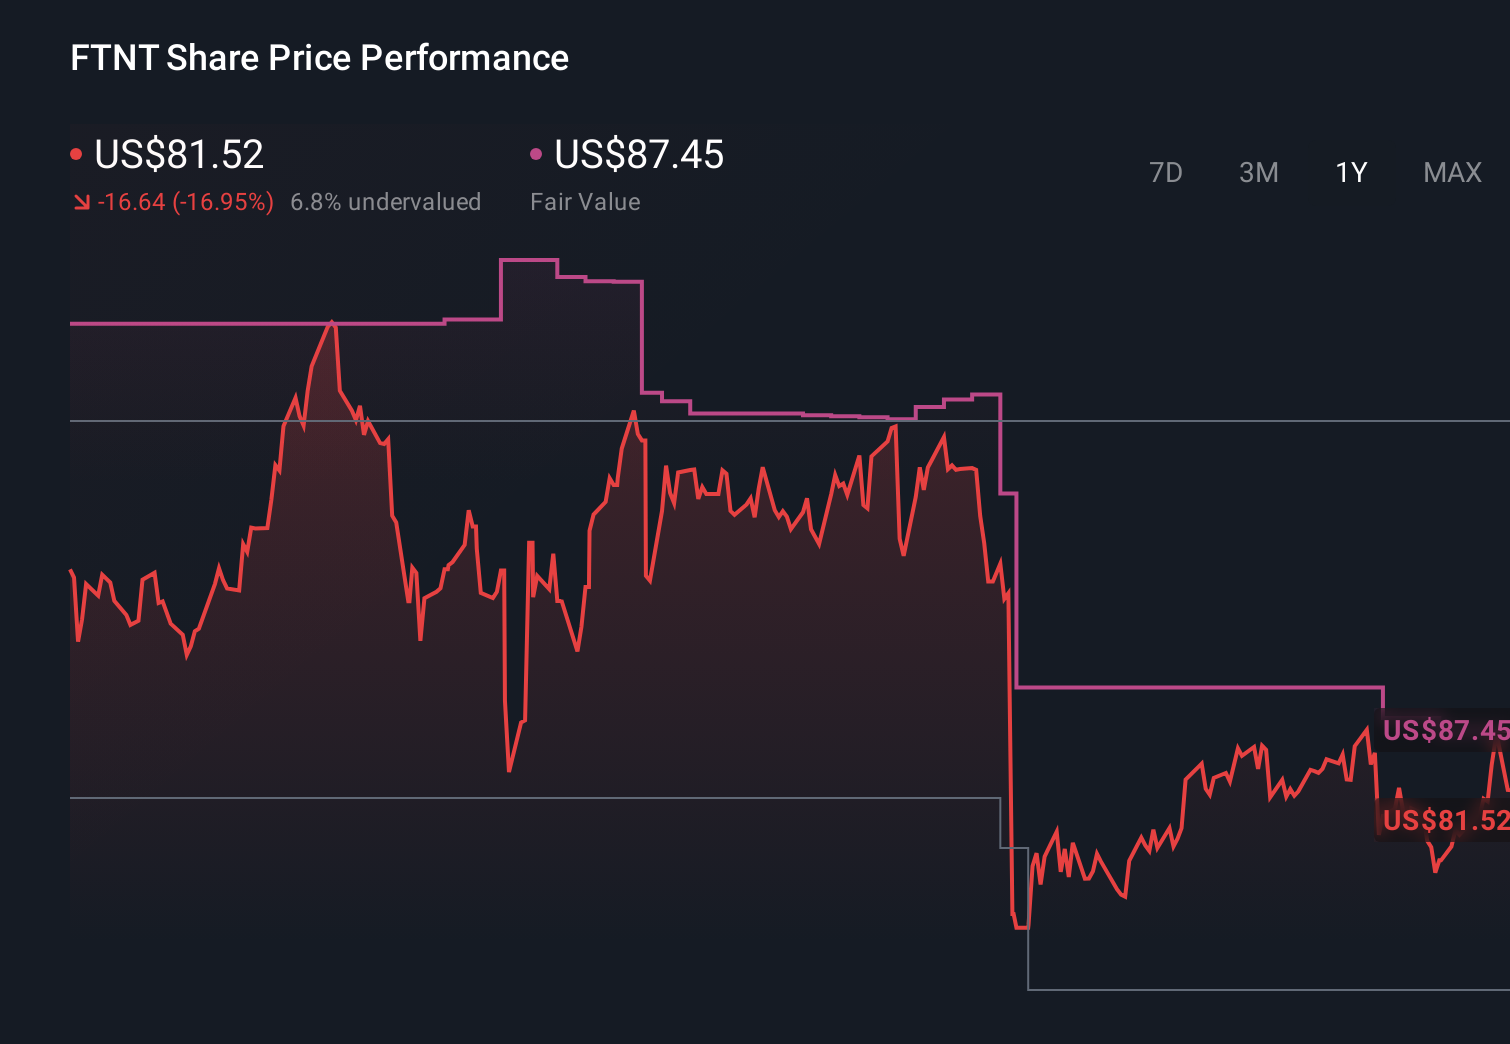
- Fortinet recently closed at US$81.64, with returns of 8.3% over the last 7 days, 0.6% over 30 days, 4.8% year to date, a 15.7% decline over 1 year, 54.9% over 3 years and 182.0% over 5 years. This gives a mixed picture of how the market has been viewing the stock over different time frames.
- Recent coverage around Fortinet has focused on its position within cybersecurity and how investor sentiment has shifted as the market reassesses risk across high growth software names. This context helps explain why the stock has seen both strong multi year returns and more recent setbacks as expectations have been reset.
- Simply Wall St currently assigns Fortinet a valuation score of 4/6, reflecting that it screens as undervalued on four of six checks. Next we will look at how different valuation methods arrive at that view before turning to an even more practical way to think about valuation at the end of the article.
Approach 1: Fortinet Discounted Cash Flow (DCF) Analysis
A DCF model projects a company’s future cash flows and then discounts them back to what they might be worth in today’s dollars. It aims to answer a simple question: what might all the future cash Fortinet generates be worth right now in total?
For Fortinet, Simply Wall St uses a 2 Stage Free Cash Flow to Equity model. The latest twelve month free cash flow is about $2.10b. Analyst and extrapolated projections suggest free cash flow could reach around $4.17b in 2030, with a series of annual forecasts in between that are discounted back to today using the model’s assumptions.
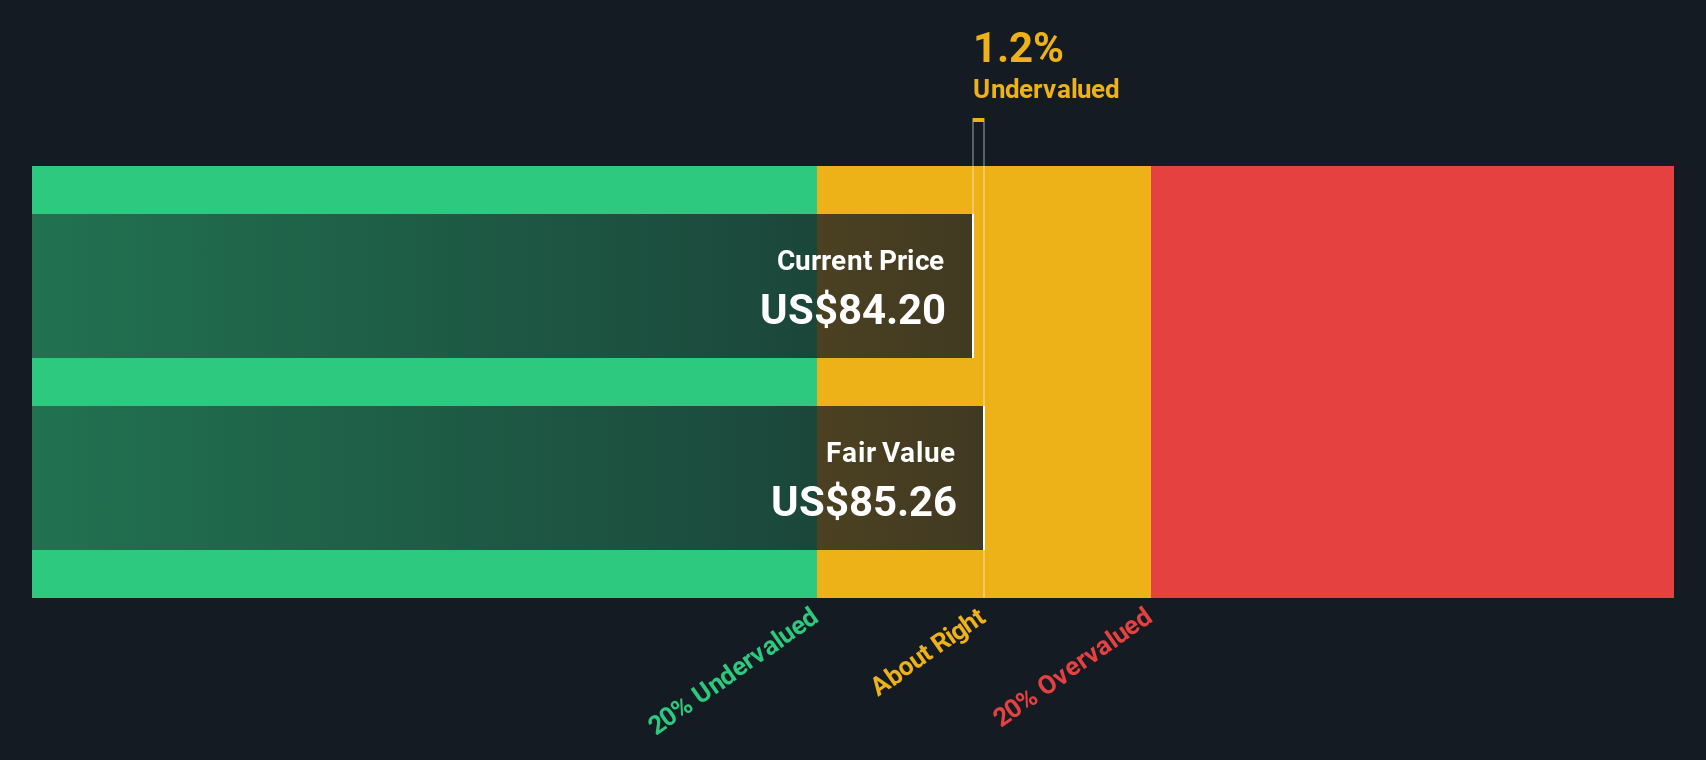
Putting those projected cash flows together, the model arrives at an estimated intrinsic value of about $103.67 per share. Compared with the recent share price of $81.64, this implies Fortinet trades at roughly a 21.3% discount, which points to the shares looking undervalued on this DCF view alone.
Result: UNDERVALUED
Our Discounted Cash Flow (DCF) analysis suggests Fortinet is undervalued by 21.3%. Track this in your watchlist or portfolio, or discover 864 more undervalued stocks based on cash flows.
Approach 2: Fortinet Price vs Earnings
For a profitable company like Fortinet, the P/E ratio is a useful way to relate what you pay per share to the earnings that each share currently generates. It helps you see how many dollars the market is willing to pay today for one dollar of current earnings.
What counts as a “normal” P/E depends on how quickly earnings are expected to grow and how risky those earnings are perceived to be. Higher growth or lower perceived risk can support a higher P/E, while lower growth or higher risk usually justifies a lower one.
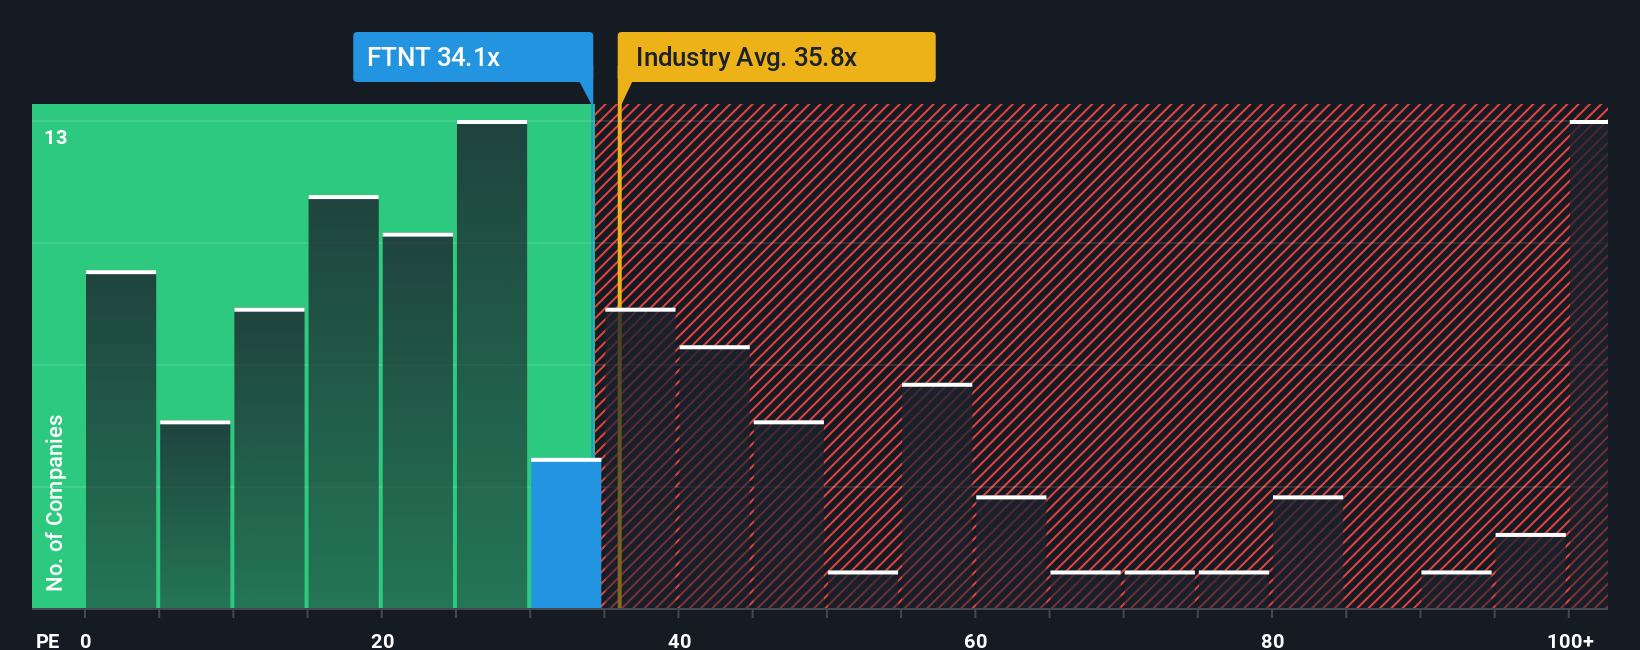
Fortinet currently trades on a P/E of 32.40x. That sits above the broader Software industry average of 30.51x, but below the 59.74x average of its selected peers. Simply Wall St also calculates a proprietary “Fair Ratio” for Fortinet of 34.75x, which is the P/E level it might expect given factors such as earnings growth, profit margins, industry, market value and risk profile.
This Fair Ratio can be more informative than a simple comparison with peers or the industry, because it attempts to adjust for Fortinet’s specific characteristics rather than assuming all companies deserve the same multiple. Since the Fair Ratio of 34.75x is modestly above the current 32.40x, the shares screen as undervalued on this P/E view.
Result: UNDERVALUED
P/E ratios tell one story, but what if the real opportunity lies elsewhere? Discover 1429 companies where insiders are betting big on explosive growth.
Upgrade Your Decision Making: Choose your Fortinet Narrative
Earlier we mentioned that there is an even better way to understand valuation, so let us introduce you to Narratives, which simply means you spell out your view of Fortinet’s story, plug in your assumptions about future revenue, earnings and margins, and see the fair value that falls out of those numbers.
A Narrative links three things in one place: the business story you believe, the financial forecast that fits that story, and the fair value that comes from that forecast.
On Simply Wall St you can create and compare Narratives on the Community page, used by millions of investors, and quickly see whether your fair value suggests Fortinet is above or below the current price and how that might guide your decision to buy, hold or sell.
Because Narratives update automatically as fresh information like earnings reports or major news is added to the platform, your fair value view for Fortinet can change in real time without you having to rebuild your model from scratch. One investor might see Fortinet as attractive at a much higher fair value, while another, using more cautious revenue and margin assumptions, could arrive at a far lower figure.
Do you think there's more to the story for Fortinet? Head over to our Community to see what others are saying!
This article by Simply Wall St is general in nature. We provide commentary based on historical data and analyst forecasts only using an unbiased methodology and our articles are not intended to be financial advice. It does not constitute a recommendation to buy or sell any stock, and does not take account of your objectives, or your financial situation. We aim to bring you long-term focused analysis driven by fundamental data. Note that our analysis may not factor in the latest price-sensitive company announcements or qualitative material. Simply Wall St has no position in any stocks mentioned.