Is It Time To Reconsider Paychex (PAYX) After Its Recent Share Price Rebound
Paychex, Inc. PAYX | 0.00 |
- If you are wondering whether Paychex at around US$102 per share still offers value or if the easy money has already been made, this article walks through what the current price tag really implies.
- Over the very short term, the stock has risen 5.6% in the last 7 days and 10.1% over the last 30 days, even though it remains down 5.7% year to date and has declined 32.3% over the past year.
- These moves are playing out against a backdrop where investors are reassessing many payroll and HR services stocks, and Paychex continues to attract attention as a large player in outsourced payroll and benefits administration. Broader conversations about outsourcing, automation of back office tasks and business spending priorities are all contributing to how the market is currently pricing the stock.
- Paychex has a valuation score of 3/6, which means it screens as undervalued on half of the six checks used here. The next sections break down what different valuation methods indicate about that price tag while also pointing to a more complete way to think about valuation toward the end of the article.
Approach 1: Paychex Discounted Cash Flow (DCF) Analysis
A Discounted Cash Flow, or DCF, model estimates what a stock could be worth by projecting future cash flows and then discounting them back to today’s dollars. It is essentially asking what the stream of future cash a business might generate is worth right now.
For Paychex, the model here uses a 2 Stage Free Cash Flow to Equity approach based on cash flow projections. The company’s latest twelve month free cash flow is about $2.1b, and analysts provide explicit free cash flow estimates for several years ahead, with Simply Wall St extrapolating the later years. Under this framework, projected free cash flow in 2035 is about $3.3b, with each year between now and then discounted back to today using a required return.
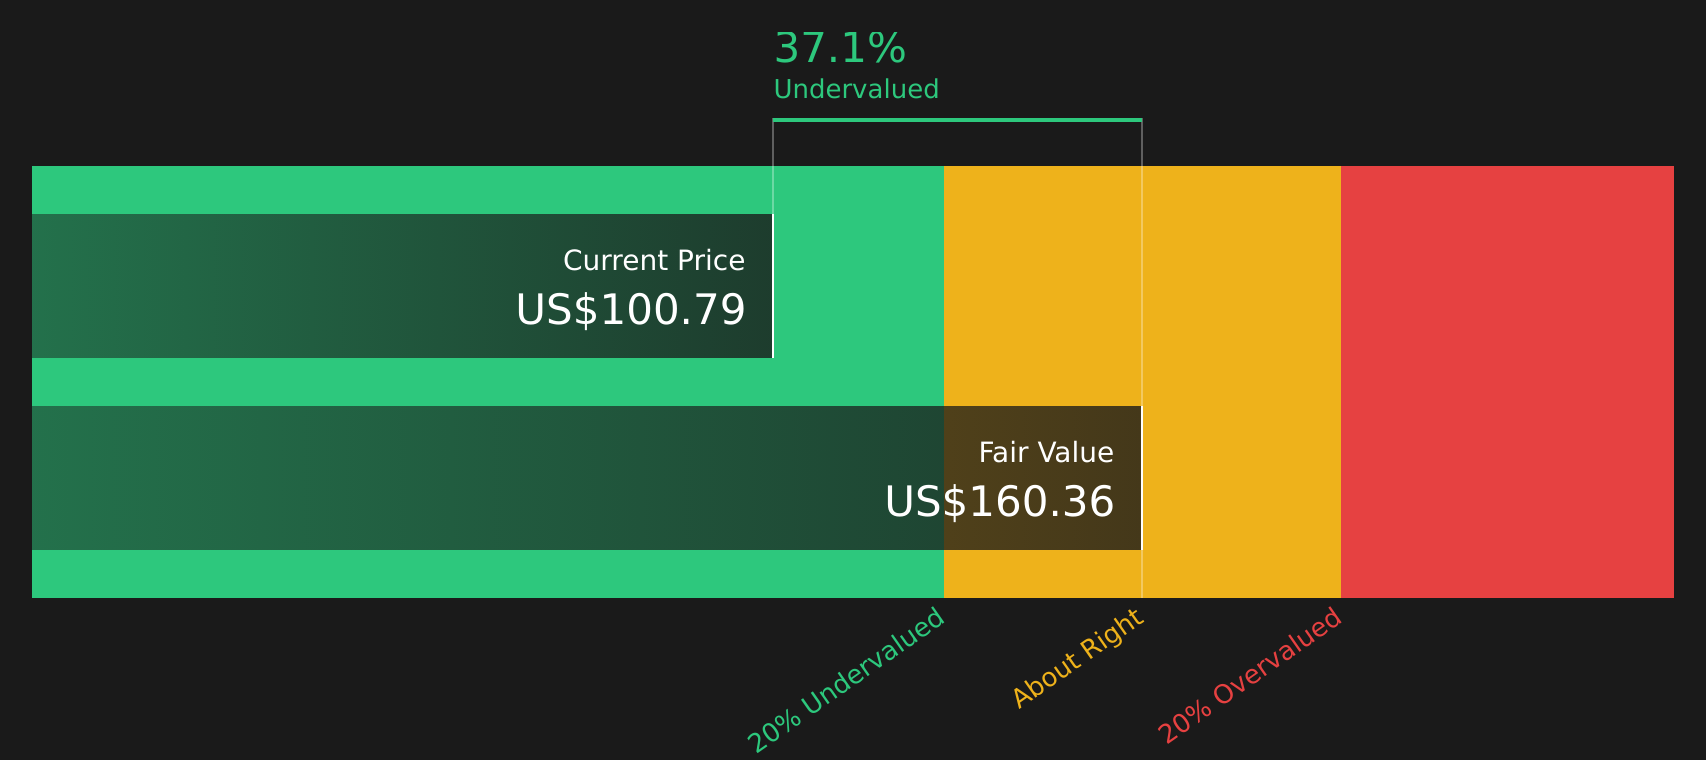
When all those discounted cash flows are added together, the resulting intrinsic value comes out at about $159.29 per share, compared with the current price around $102. This gap implies the stock screens as about 35.7% undervalued on this DCF view.
Result: UNDERVALUED
Our Discounted Cash Flow (DCF) analysis suggests Paychex is undervalued by 35.7%. Track this in your watchlist or portfolio, or discover 47 more high quality undervalued stocks.
Approach 2: Paychex Price vs Earnings
For profitable companies like Paychex, the P/E ratio is a useful quick check because it directly links what you pay for the stock to the earnings the business is currently generating. Higher expected growth and lower perceived risk usually justify a higher P/E, while lower growth expectations or higher risk tend to align with a lower, more cautious multiple.
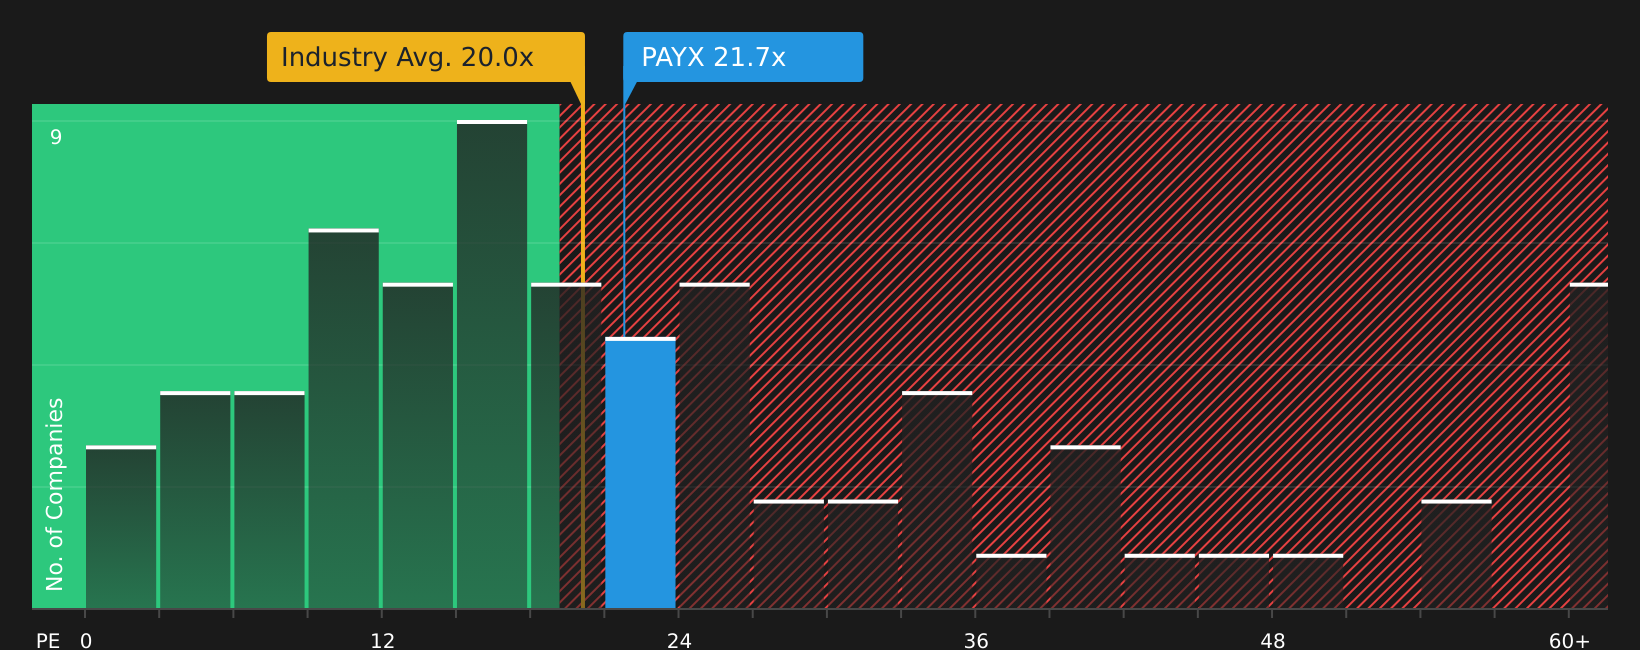
Paychex currently trades on a P/E of 22.43x, compared with a Professional Services industry average of about 19.59x and a peer average of 18.61x. Simply Wall St’s “Fair Ratio” for Paychex is 23.69x, which is an estimate of what the P/E could reasonably be given factors such as its earnings profile, industry, profit margins, market cap and risk inputs. This Fair Ratio goes further than a simple peer or industry comparison because it is tailored to Paychex rather than assuming that all companies in the group deserve similar multiples.
Set against the Fair Ratio of 23.69x, the current P/E of 22.43x sits slightly lower. On this framework, that points to the stock screening as undervalued on an earnings multiple view.
Result: UNDERVALUED
P/E ratios tell one story, but what if the real opportunity lies elsewhere? Start investing in legacies, not executives. Discover our 20 top founder-led companies.
Upgrade Your Decision Making: Choose your Paychex Narrative
Earlier it was mentioned that there is an even better way to understand valuation, so this is where Narratives come in as a simple way for you to attach a clear story about Paychex to the numbers, link that story to a forecast for revenue, earnings and margins, then translate it into a Fair Value you can compare with the current share price.
On Simply Wall St’s Community page, Narratives let you pick or build a view that matches how you see Paychex. For example, you can choose a more optimistic story that lines up with a Fair Value near US$143.85, or a more cautious story closer to US$90.00. You can then see how each view treats assumptions like revenue in the US$7.4b to US$7.8b range, earnings between about US$2.2b and US$2.5b by 2029, and P/E ratios between roughly 17.6x and 25.5x.
Because these Narratives update when new information hits, such as Paycor integration news, AI product launches or fresh earnings, you can quickly see whether your preferred Fair Value still looks attractive relative to the live price or whether the gap has closed. This can help you decide if the stock currently looks closer to your version of underpriced, fairly priced or expensive.
For Paychex, however, we will make it really easy for you with previews of two leading Paychex Narratives:
First up is a more bullish angle that treats recent AI work, data scale and the Paycor integration as reasons the stock could be worth more than it trades for today.
Fair Value in this bullish narrative: US$143.85 per share
Implied discount to this Fair Value at US$102.44: about 29% below the narrative Fair Value
Revenue growth assumption: 9.02% a year
- AI tools, large proprietary datasets and the Paycor integration are seen as levers for higher productivity, stronger pricing power and a larger addressable market over time.
- More optimistic analysts tie this to revenue reaching about US$7.8b and earnings of roughly US$2.5b by 2029, with profit margins rising and a P/E of 25.5x on those earnings.
- This view assumes investors will pay a higher multiple than the sector for a business that can pair scaled HCM platforms with AI driven features, while acknowledging execution risks around Paycor, insurance trends and AI spending.
The second narrative is closer to analyst consensus and treats the current setup as more balanced on risk and reward, with Paycor benefits and AI tools weighed against integration work, costs and client behavior.
Fair Value in this more cautious narrative: US$100.93 per share
Implied premium to this Fair Value at US$102.44: about 1% above the narrative Fair Value
Revenue growth assumption: 5.91% a year
- Analysts highlight Paycor and AI investments as supports for earnings and client retention, but also point to integration challenges and higher employee related costs that could pressure margins.
- The consensus view ties Fair Value to revenue of about US$7.5b and earnings of roughly US$2.3b by 2029 on a P/E of 19.0x, with a relatively tight range of estimates around those numbers.
- Risks in this storyline center on client sensitivity to pricing, health plan choices and business conditions, which could keep revenue closer to guidance lows and limit how far the valuation multiple can stretch.
If these two previews feel too simplified, you can dig into the full narratives, compare the detailed assumptions and then adjust the inputs so the Fair Value lines up with how you personally see Paychex.
To see how these results tie into long-term growth, risks, and valuation, check out the full range of community narratives for Paychex on Simply Wall St. Add the company to your watchlist or portfolio so you'll be alerted when the story evolves.
Do you think there's more to the story for Paychex? Head over to our Community to see what others are saying!

This article by Simply Wall St is general in nature. We provide commentary based on historical data and analyst forecasts only using an unbiased methodology and our articles are not intended to be financial advice. It does not constitute a recommendation to buy or sell any stock, and does not take account of your objectives, or your financial situation. We aim to bring you long-term focused analysis driven by fundamental data. Note that our analysis may not factor in the latest price-sensitive company announcements or qualitative material. Simply Wall St has no position in any stocks mentioned.