Is It Time To Reconsider Procter & Gamble (PG) After Recent Share Price Weakness?
The Procter & Gamble PG | 0.00 |
- If you are wondering whether Procter & Gamble stock now offers better value or still looks expensive, it helps to start with how the current price lines up against the fundamentals.
- The share price closed at US$140.82, with returns that declined 1.5% over the last week and 4.4% over the last month, while the move over 1 year is a decline of 13.2% and the 3 and 5 year returns are 5.3% and 18.6% respectively.
- Recent headlines around consumer spending patterns and brand strength in everyday household products have kept attention on how resilient demand is for staples like those in Procter & Gamble's portfolio. At the same time, broader discussions about costs and pricing power across the sector give extra context to the share price moves you are seeing on the chart.
- On Simply Wall St's valuation framework, Procter & Gamble scores 4 out of 6, which means it screens as undervalued on four checks and fairly or overvalued on two. The next step is to compare what different valuation methods suggest today and then consider an even richer way of thinking about valuation at the end of this article.
Approach 1: Procter & Gamble Discounted Cash Flow (DCF) Analysis
A Discounted Cash Flow, or DCF, model takes estimates of a company’s future cash flows and discounts them back to today’s dollars to arrive at an estimate of what the business might be worth right now.
For Procter & Gamble, the latest twelve month Free Cash Flow is about $15.6b. On Simply Wall St’s 2 Stage Free Cash Flow to Equity model, analyst estimates are used where available and then extended further out. For example, projected Free Cash Flow for 2028 is $16.8b, with additional estimates and extrapolations out to 2035 included in the calculation.
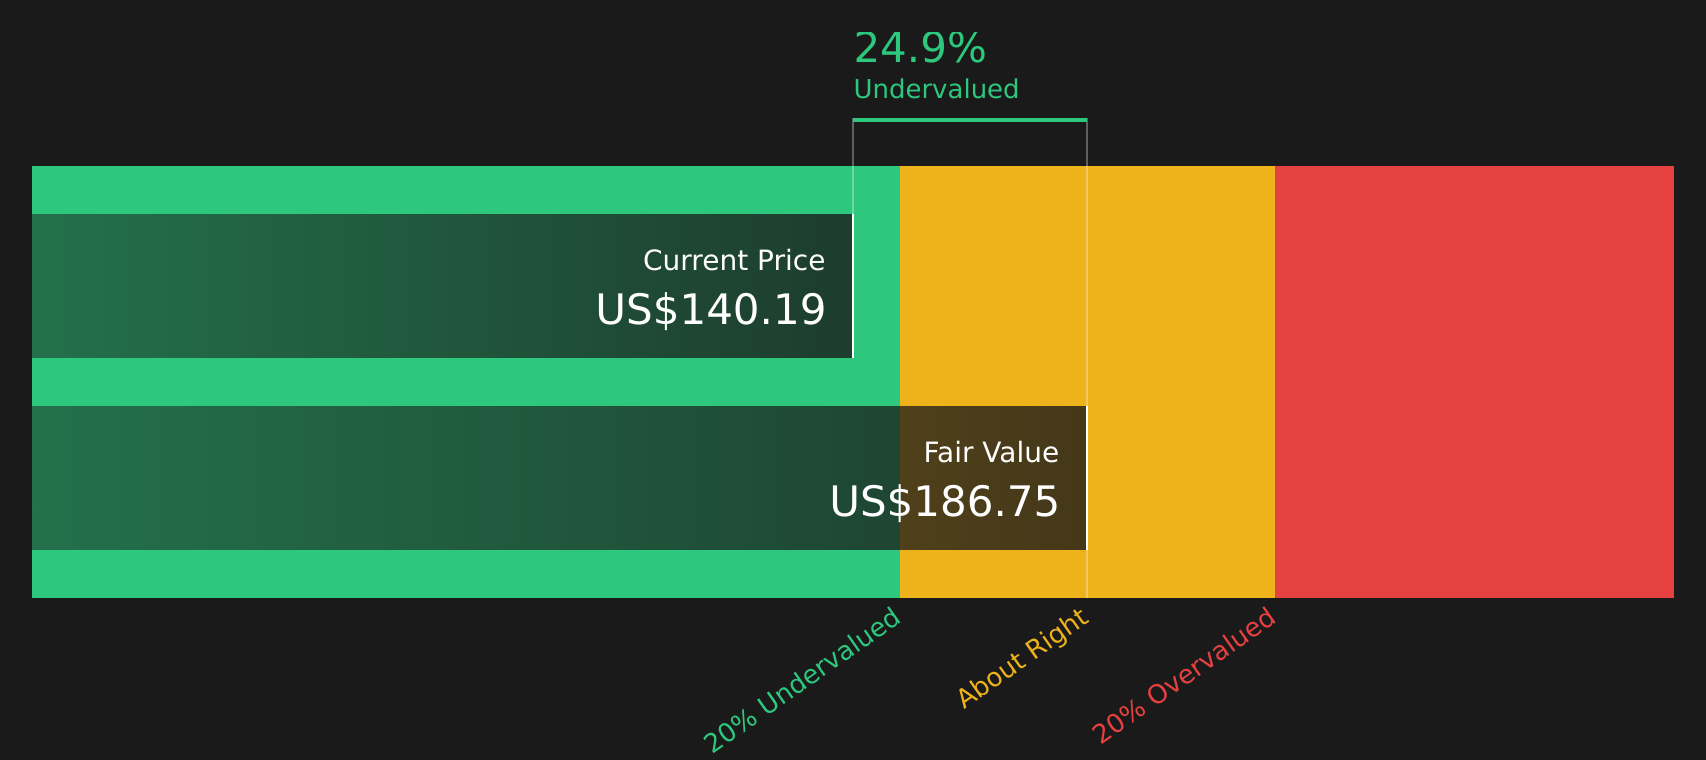
Putting those projected cash flows together and discounting them back gives an estimated intrinsic value of about $186.75 per share. Against the recent share price of $140.82, this implies the stock screens as around 24.6% undervalued under this DCF framework.
Result: UNDERVALUED
Our Discounted Cash Flow (DCF) analysis suggests Procter & Gamble is undervalued by 24.6%. Track this in your watchlist or portfolio, or discover 46 more high quality undervalued stocks.
Approach 2: Procter & Gamble Price vs Earnings
For a consistently profitable company, the P/E ratio is a useful way to think about what you are paying for each dollar of earnings. The higher the growth expectations and the lower the perceived risk, the higher the P/E ratio investors are usually willing to accept as “normal” or “fair.”
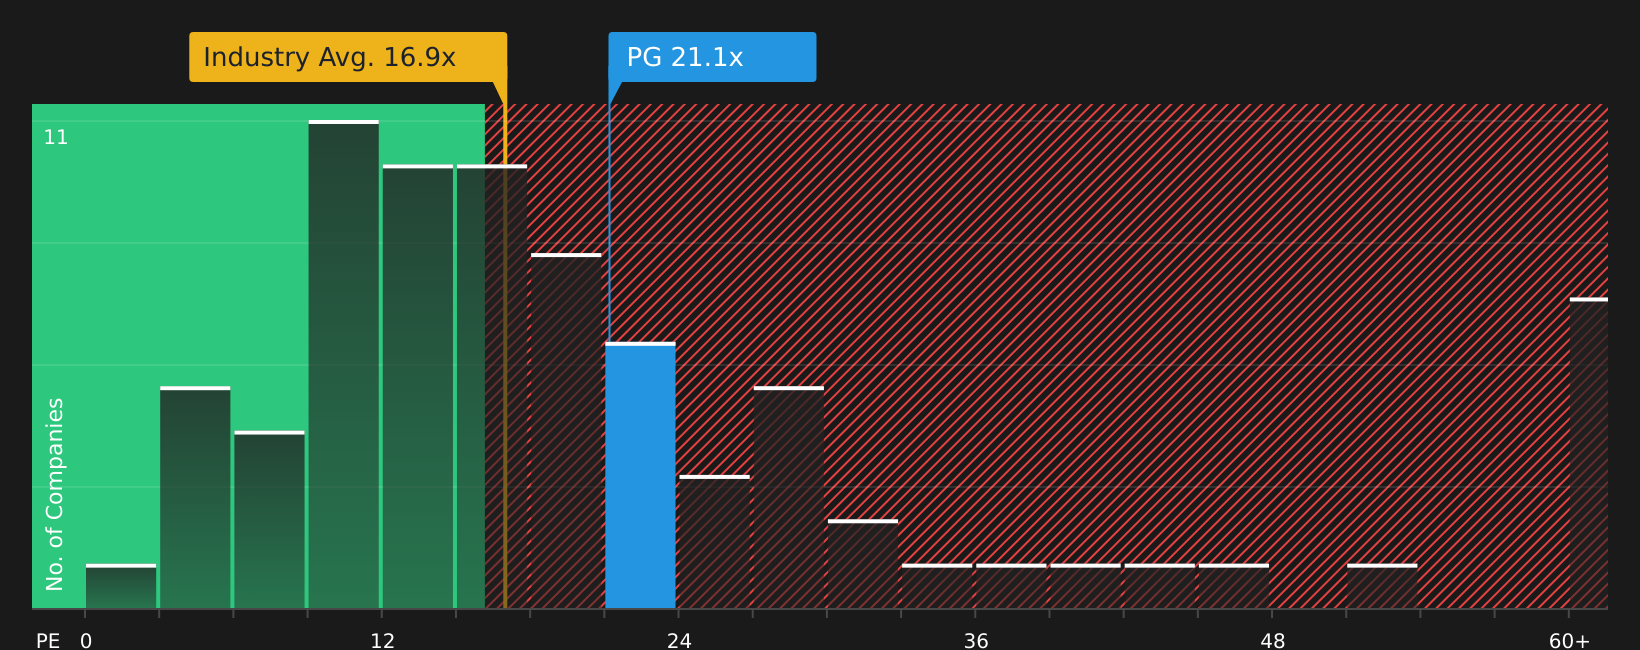
Procter & Gamble currently trades on a P/E of 20.1x. That sits above the Household Products industry average of 16.9x, but below the peer group average of 24.5x. So on a simple comparison, the stock looks more expensive than the broader industry, yet cheaper than some close peers.
Simply Wall St’s Fair Ratio for Procter & Gamble is 22.3x. This is a proprietary estimate of what the P/E might be, given factors such as earnings growth, profit margins, industry, market cap and company specific risks. Because it brings all of these into one number, the Fair Ratio can provide a more tailored reference point than broad industry or peer averages.
Comparing the Fair Ratio of 22.3x with the current P/E of 20.1x suggests the stock screens as undervalued on this metric.
Result: UNDERVALUED
P/E ratios tell one story, but what if the real opportunity lies elsewhere? Start investing in legacies, not executives. Discover our 20 top founder-led companies.
Upgrade Your Decision Making: Choose your Procter & Gamble Narrative
Earlier it was mentioned that there is an even better way to think about valuation, so Narratives are introduced here as a simple way for you to attach a clear story about Procter & Gamble, including your own fair value, revenue, earnings and margin assumptions, to a financial forecast that then links straight through to a fair value you can compare with today’s share price.
On Simply Wall St’s Community page, Narratives are an easy tool used by millions of investors to capture a thesis in numbers. They help you decide whether the current price looks attractive or stretched by setting your Fair Value next to the live market price and updating that view automatically when new data, such as earnings or news, arrives.
For Procter & Gamble, for example, one Narrative might assume a fair value around US$186.75 based on higher conviction in long term cash flows. Another might sit closer to US$121.06 with more cautious expectations. Seeing both side by side makes it clear how different views on margins, growth and required returns can lead to very different conclusions about whether the stock looks cheap or expensive to you.
For Procter & Gamble, however, we will make it really easy for you with previews of two leading Procter & Gamble Narratives:
Together they show how two careful readers of the same data can reach very different conclusions about what counts as a reasonable fair value. This is exactly the kind of contrast that can sharpen your own view of the stock.
Fair value in this Narrative: US$150.00 per share
Implied undervaluation vs last close: about 6.1% below this fair value
Revenue growth assumption: 8.09%
- Frames Procter & Gamble as a high quality, cash generative consumer staples business with a long list of globally recognised brands and healthy margins around 50% at the gross level and close to 18% to 19% at the net level.
- Highlights balance sheet capacity and interest cover of about 51 times as support for the current valuation. It still flags insider selling and recent share price weakness as factors worth monitoring closely.
- Sees current pricing as moving into oversold territory. The Narrative argues that a fair value in the US$150 area is reasonable given the company’s earnings profile and stability.
Fair value in this Narrative: US$121.06 per share
Implied overvaluation vs last close: about 16.3% above this fair value
Revenue growth assumption: 3.32%
- Starts from the view that Procter & Gamble is a mature business with projected revenue growth of 3.32%, so it treats even modest valuation stretches with caution despite wide moat and low uncertainty ratings from third party sources.
- Builds a fair value of US$121.06 using a blended set of methods including DDM, DCF, and multiple based approaches. It argues that Monte Carlo simulations around these inputs point to a high probability that the stock is priced above this range.
- Emphasises that while many traditional multiples such as historical P/E, P/CF and EV/EBITDA suggest some support for the price, cash flow and earnings based valuation work keeps pulling the fair value meaningfully below the current share price.
These two Narratives sit on opposite sides of the line, one suggesting the market is too pessimistic and the other that investors are paying too much for quality. Reading both in full can be helpful when you decide which assumptions fit your own view of Procter & Gamble.
Do you think there's more to the story for Procter & Gamble? Head over to our Community to see what others are saying!

This article by Simply Wall St is general in nature. We provide commentary based on historical data and analyst forecasts only using an unbiased methodology and our articles are not intended to be financial advice. It does not constitute a recommendation to buy or sell any stock, and does not take account of your objectives, or your financial situation. We aim to bring you long-term focused analysis driven by fundamental data. Note that our analysis may not factor in the latest price-sensitive company announcements or qualitative material. Simply Wall St has no position in any stocks mentioned.