Is It Time To Reconsider Super Micro Computer (SMCI) After Recent Price Swings And DCF Results
Super Micro Computer, Inc. SMCI | 0.00 |
- If you are wondering whether Super Micro Computer stock is priced fairly or if the recent moves have left value on the table, this article breaks down what the current valuation signals might be telling you.
- Over the past month the stock price has changed by 20.2%, while the 1-year return shows a 13.2% decline and the 3-year return stands at 104.3%. Together, these figures present a mixed picture of how the market has treated the stock over different timeframes.
- Recent coverage has focused on Super Micro Computer's role in high performance computing and data center hardware. This keeps attention on how its products fit into broader technology trends and helps explain why the stock can experience periods of sharp interest as investors reassess its potential and risks.
- Right now Super Micro Computer holds a valuation score of 5 out of 6. The next sections break down what different valuation approaches say about that score, and then conclude with a broader way to think about what the stock might be worth over time.
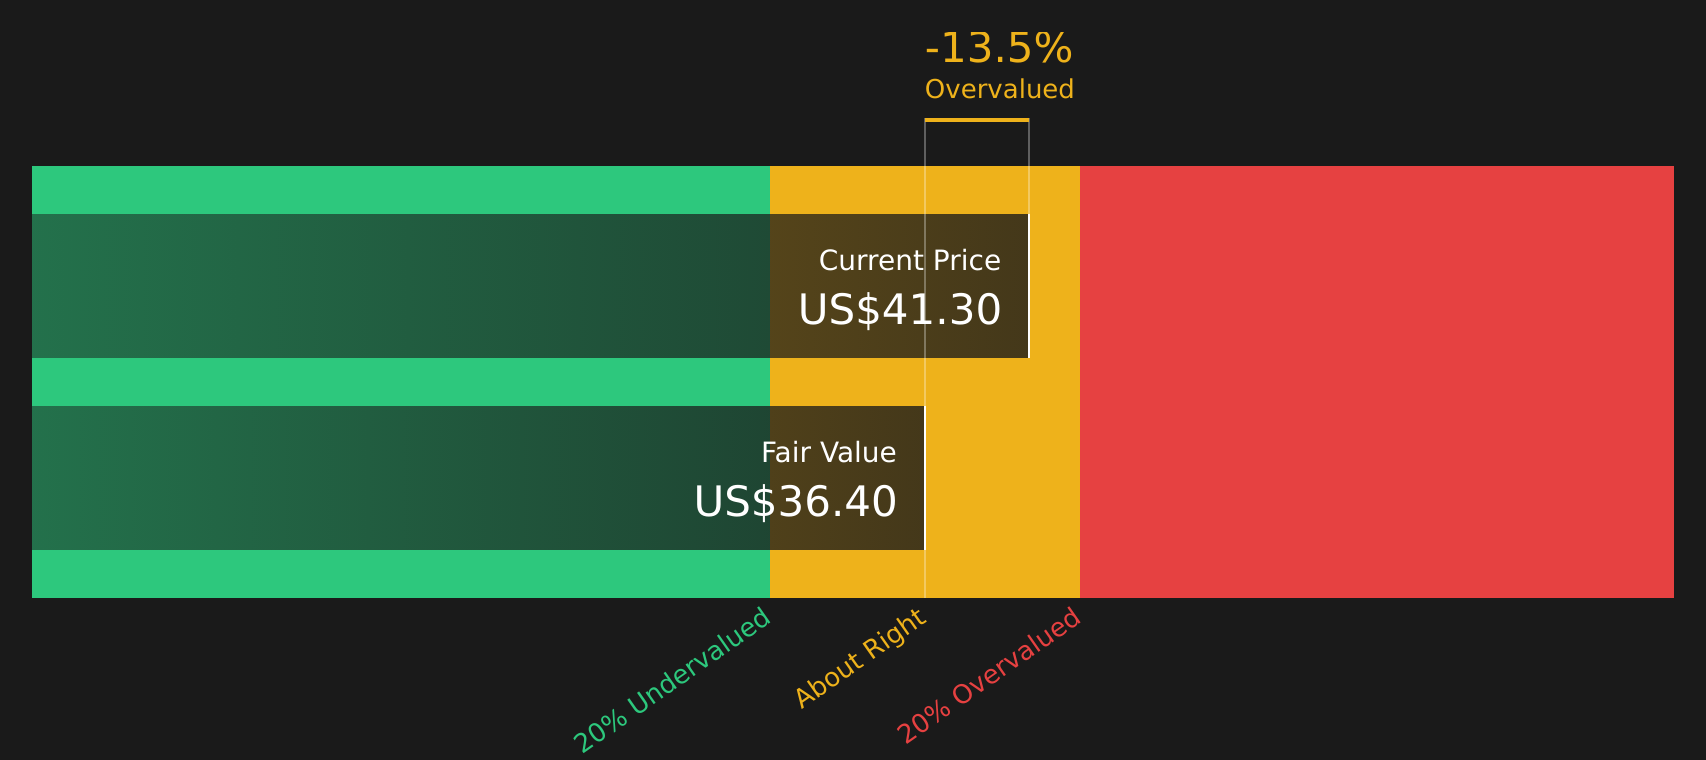
Approach 1: Super Micro Computer Discounted Cash Flow (DCF) Analysis
A Discounted Cash Flow model looks at the cash Super Micro Computer is expected to generate in the future, then discounts those cash flows back to today to estimate what the business could be worth right now in dollar terms.
For Super Micro Computer, the latest twelve month free cash flow is about $394 million. Analysts and extrapolated estimates point to free cash flow projections that range from a loss of $1,860.43 million in 2026 to $2,619.41 million in 2035, with Simply Wall St extending the view beyond the initial analyst window. These projected figures are then discounted using a 2 Stage Free Cash Flow to Equity model to reflect the time value of money and risk.
On this basis, the DCF model suggests an estimated intrinsic value of $44.16 per share. Compared with the current share price used in this model, the output implies the stock is 36.8% undervalued.
Result: UNDERVALUED
Our Discounted Cash Flow (DCF) analysis suggests Super Micro Computer is undervalued by 36.8%. Track this in your watchlist or portfolio, or discover 48 more high quality undervalued stocks.
Approach 2: Super Micro Computer Price vs Earnings
For profitable companies, the P/E ratio is a useful yardstick because it links what you pay directly to the earnings the business is generating today. It also gives you a quick way to compare how the market is treating those earnings across different companies in the same space.
What counts as a reasonable P/E depends on how quickly earnings are expected to grow and how risky those earnings are. Higher growth and lower perceived risk can justify a higher multiple, while slower growth or higher uncertainty usually point to a lower one.
Super Micro Computer currently trades on a P/E of 19.21x. That sits below both the Tech industry average of 23.82x and the selected peer group average of 44.50x, which might initially suggest a lower market valuation than many peers. Simply Wall St also calculates a proprietary “Fair Ratio” of 63.97x, which estimates the P/E that might be appropriate after considering factors such as earnings growth, profit margins, industry, market cap and risk profile.
Because the Fair Ratio is tailored to Super Micro Computer, it offers a more company specific anchor than broad industry or peer comparisons. Setting this Fair Ratio of 63.97x against the current 19.21x suggests the stock is trading at a lower multiple than that model would imply.
Result: UNDERVALUED

P/E ratios tell one story, but what if the real opportunity lies elsewhere? Start investing in legacies, not executives. Discover our 17 top founder-led companies.
Upgrade Your Decision Making: Choose your Super Micro Computer Narrative
Earlier it was mentioned that there is an even better way to understand valuation, so this is where Narratives come in, giving you a simple way to attach your story about Super Micro Computer to hard numbers like your fair value estimate and your assumptions for future revenue, earnings and margins.
A Narrative on Simply Wall St is your own explanation of what is happening at a company, linked directly to a financial forecast so that the story and the spreadsheet line up, instead of sitting in separate buckets.
On the Community page, millions of investors are already using Narratives as an accessible tool, setting out their view of Super Micro Computer, the cash flows and margins they think are realistic, and the fair value that falls out of those assumptions.
Once a Narrative is in place, it helps you compare your fair value estimate to the current price, so you can see in one view whether your story suggests the stock is richly priced, in line with your estimate or trading below your assessed value.
Narratives also update when new information arrives. If Super Micro Computer reports new earnings, faces a legal development or announces a major AI contract, the inputs and resulting fair value inside that Narrative can be refreshed without rebuilding your thinking from scratch.
For example, one Super Micro Computer Narrative on the platform currently applies a fair value of about US$16 per share based on more cautious assumptions and a low 6.5x future P/E. Another uses a fair value near US$55 with faster assumed revenue growth of roughly 36% and a 21.6x future P/E. This gives you a clear sense of how different stories produce very different valuations even for the same stock.
For Super Micro Computer however, we will make it really easy for you with previews of two leading Super Micro Computer Narratives:
These sit on opposite sides of the debate, so they give you a clear way to stress test your own view against how other investors are joining the dots between story and numbers.
Fair value in this Narrative: US$74.53 per share
Implied undervaluation versus last close of US$27.92: about 63%
Revenue growth used in this Narrative: 50%
- Leans heavily on management guidance, using revenue of US$23b to US$25b for 2025 and US$40b for 2026 as the foundation for the forecast.
- Builds a case around Direct Liquid Cooling adoption in new data centers and partnerships with Nvidia, AMD, xAI and Intel to support demand across AI, cloud, 5G and storage.
- Applies a 50% revenue growth rate, a 6.64% net profit margin and a 20x forward P/E to arrive at fair value outcomes that sit materially above the recent share price.
Fair value in this Narrative: US$26.00 per share
Implied overvaluation versus last close of US$27.92: about 7%
Revenue growth used in this Narrative: 15.05%
- Recognises Super Micro Computer's position in AI focused server and data center hardware, including energy efficient, high density systems and links with major chip suppliers.
- Places most weight on governance issues, including the Hindenburg Research report, questions around financial reporting and the resignation of auditor Ernst & Young.
- Flags potential outcomes such as investigations, penalties and listing risk, then ties those concerns into a lower fair value estimate using more moderate revenue growth and a lower future P/E multiple.
Taken together, these Narratives show how reasonable investors can look at the same business and arrive at very different conclusions once they plug in their own assumptions for growth, margins, risk and the multiple they are willing to pay.
To see what the community is saying about Super Micro Computer beyond these two cases and how the full range of Narratives lines up with your view, you can review the wider set of Narratives on the company.See what the community is saying about Super Micro Computer
Do you think there's more to the story for Super Micro Computer? Head over to our Community to see what others are saying!

This article by Simply Wall St is general in nature. We provide commentary based on historical data and analyst forecasts only using an unbiased methodology and our articles are not intended to be financial advice. It does not constitute a recommendation to buy or sell any stock, and does not take account of your objectives, or your financial situation. We aim to bring you long-term focused analysis driven by fundamental data. Note that our analysis may not factor in the latest price-sensitive company announcements or qualitative material. Simply Wall St has no position in any stocks mentioned.