Is It Time To Reconsider T. Rowe Price Group (TROW) After Its Recent 20.9% Gain?
T. Rowe Price Group, Inc. TROW | 0.00 |
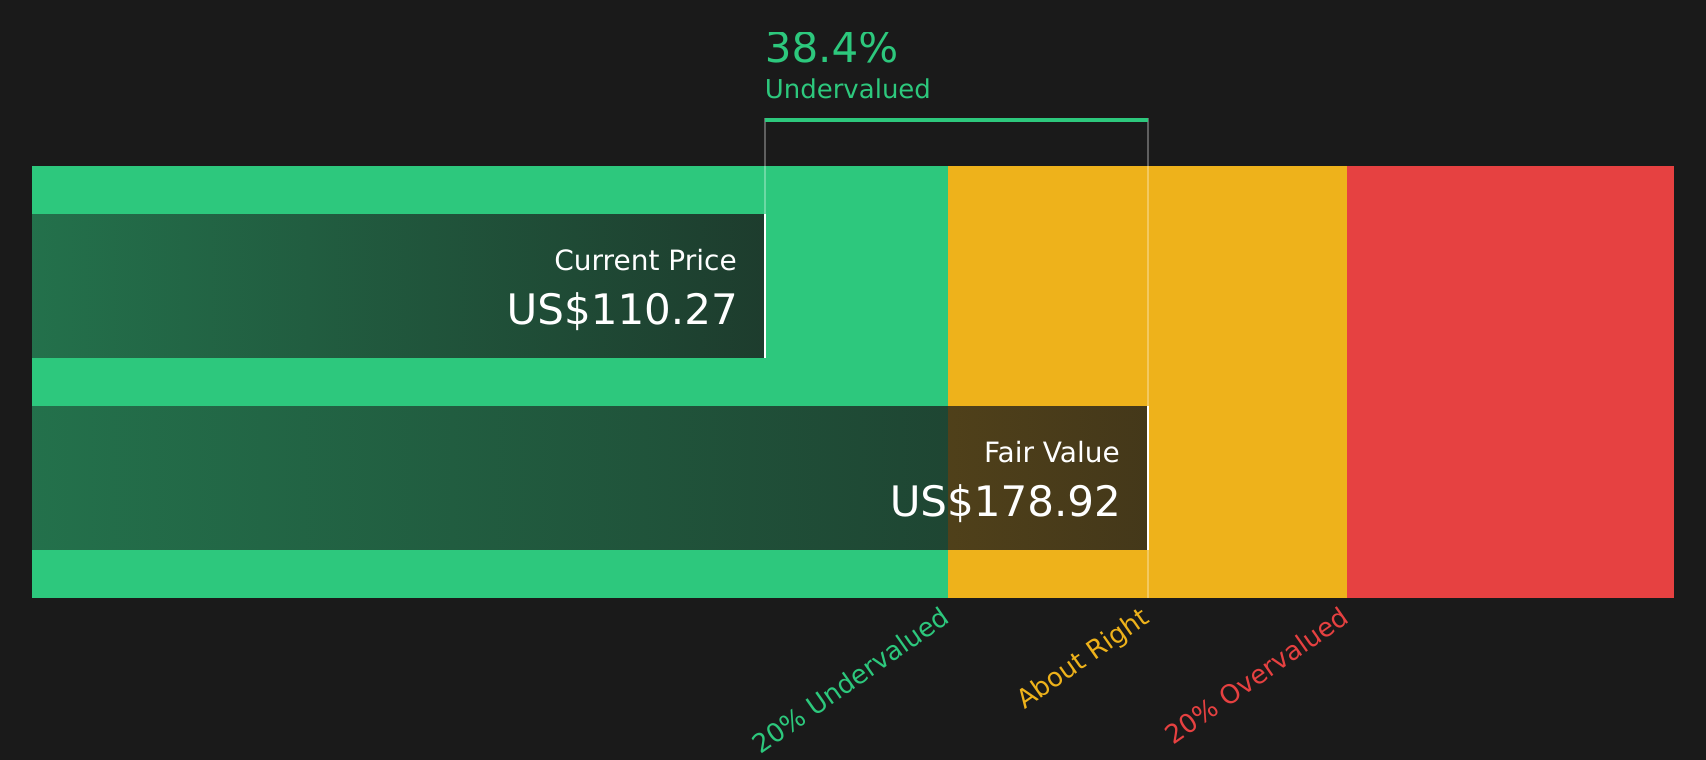
- If you are wondering whether T. Rowe Price Group at US$106.96 is priced attractively or not, the key question is how that tag compares with the company’s underlying value.
- The stock has returned 3.3% over the past week, 2.7% over the last month and 2.2% year to date, with a 20.9% return over the past year, while the 3 year return sits at 8.5% and the 5 year return reflects a 29.9% decline.
- Recent attention on T. Rowe Price Group has been shaped by ongoing interest in asset and wealth management companies, as investors reassess how fee based businesses fit into their portfolios. This backdrop helps explain why the stock’s recent moves are being watched closely for signals about sentiment toward the sector.
- On Simply Wall St’s valuation checks, T. Rowe Price Group scores 5 out of 6 for being undervalued. That valuation score sets the stage for a look at conventional tools like P/E and discounted cash flow, before finishing with a broader way of thinking about value later in the article.
Approach 1: T. Rowe Price Group Excess Returns Analysis
The Excess Returns model looks at how effectively a company turns its equity base into earnings above the return that shareholders require. Instead of focusing on cash flows alone, it compares the return on equity to the cost of equity and capitalizes that “excess” value creation.
For T. Rowe Price Group, book value is $50.16 per share and the stable book value used in the model is $51.17 per share, based on future book value estimates from 2 analysts. The model assumes stable earnings per share of $8.82, sourced from weighted future return on equity estimates from 4 analysts, against a cost of equity of $3.95 per share. That leaves an excess return of $4.86 per share, supported by an average return on equity of 17.23%.
When these excess returns are projected forward and discounted, the model arrives at an intrinsic value estimate of about $167.34 per share. Compared with the recent share price of $106.96, the Excess Returns model implies the stock is 36.1% undervalued.
Result: UNDERVALUED
Our Excess Returns analysis suggests T. Rowe Price Group is undervalued by 36.1%. Track this in your watchlist or portfolio, or discover 47 more high quality undervalued stocks.
Approach 2: T. Rowe Price Group Price vs Earnings
P/E is a common way to look at profitable companies, because it links what you pay for the stock directly to the earnings it is generating today. Higher growth expectations or lower perceived risk usually support a higher P/E ratio, while slower growth or higher risk tend to justify a lower one.
T. Rowe Price Group currently trades on a P/E of 11.21x. This sits well below the Capital Markets industry average of 39.14x and also below the peer average of 33.06x. On the surface, that gap can suggest a discount, but simple comparisons like this do not adjust for the company’s specific growth outlook, margins, size or risk profile.
Simply Wall St’s Fair Ratio seeks to do exactly that. It is a proprietary P/E estimate that reflects factors such as earnings growth, industry, profit margin, market cap and identified risks, which can give a more tailored anchor than broad peer or industry averages. For T. Rowe Price Group, the Fair Ratio is 13.43x, which is moderately higher than the current 11.21x multiple. On this measure, the stock screens as undervalued relative to what the Fair Ratio suggests might be reasonable.
Result: UNDERVALUED

P/E ratios tell one story, but what if the real opportunity lies elsewhere? Start investing in legacies, not executives. Discover our 21 top founder-led companies.
Upgrade Your Decision Making: Choose your T. Rowe Price Group Narrative
Earlier it was mentioned that there is an even better way to understand valuation. Narratives bring that to life by letting you attach a clear story about T. Rowe Price Group to the numbers you think are reasonable for its future revenue, earnings, margins and fair value. You can then compare that Fair Value with the current share price to decide whether you see the stock as attractively priced or not.
On Simply Wall St, Narratives sit in the Community page and are used by millions of investors as an easy tool that links a company’s story to a financial forecast and then to a fair value. They update automatically when new information such as earnings or news is added so your view does not go stale.
For T. Rowe Price Group, one investor might align with the more bullish narrative that ties a Fair Value of US$107.00 to assumptions for higher revenue growth, improving margins and a 12.5x P/E in 2029. Another investor might lean toward the more cautious narrative that anchors Fair Value closer to US$79.23 with flat earnings, softer revenue assumptions and a 10.9x P/E. Narratives simply make these different perspectives explicit so you can decide which story fits your own expectations.
For T. Rowe Price Group, here are previews of two leading T. Rowe Price Group Narratives that make comparison straightforward:
Each one ties the same stock price to a different story about flows, fees and margins. Your job is simply to decide which version feels closer to how you see the business playing out, or whether your view sits somewhere in between.
Fair value in this bullish narrative is US$107.00 per share.
At the last close of US$106.96, that implies the stock is about 0.0% below this fair value estimate.
Revenue growth assumption in this narrative is 2.63% a year.
- ETF and alternative investment products, along with new retirement tools, are used to support assets under management and fee revenue.
- Analysts in this camp model slightly higher profit margins, modest earnings growth to about US$2.3b by 2029 and a P/E of 12.5x on those earnings.
- The key watchpoints are fee compression, sizable net outflows in 2024 and the risk that competitive pressure and market conditions limit revenue and margin progress.
Fair value in this more cautious narrative is US$97.42 per share.
At the last close of US$106.96, that implies the stock is about 9.8% above this fair value estimate.
Revenue growth assumption in this narrative is 1.86% a year.
- Retirement and ETF products, global expansion and technology investment are expected to support assets under management and efficiency, but not remove pressure on the core active franchise.
- Analysts here assume margins step down from 27.6% to 24.7% and earnings ease to about US$1.9b by 2029, with the stock still on a 12.5x P/E.
- Structural fee pressure, ongoing outflows from higher fee products and competition from low cost and technology led providers are central risks to revenue, margins and market share.
If you want to see how other investors connect their own assumptions on fees, flows and margins to a fair value range for this stock, See what the community is saying about T. Rowe Price Group.
Do you think there's more to the story for T. Rowe Price Group? Head over to our Community to see what others are saying!

This article by Simply Wall St is general in nature. We provide commentary based on historical data and analyst forecasts only using an unbiased methodology and our articles are not intended to be financial advice. It does not constitute a recommendation to buy or sell any stock, and does not take account of your objectives, or your financial situation. We aim to bring you long-term focused analysis driven by fundamental data. Note that our analysis may not factor in the latest price-sensitive company announcements or qualitative material. Simply Wall St has no position in any stocks mentioned.