

Is It Time To Reconsider T. Rowe Price Group (TROW) After Mixed Long Term Returns
T. Rowe Price Group, Inc. TROW | 0.00 |
- If you are wondering whether T. Rowe Price Group at around US$103.55 is giving you enough value for the risk you are taking, this article walks through what the current price might be implying.
- The stock has inched up 1.6% over the last week and 2.8% over the last month, while the one year return sits at 15.7%. However, the five year return shows a decline of 32.1% and year to date performance is down 1.0%.
- Recent coverage has focused on how asset managers are positioning their product ranges, fee structures and distribution, which can all influence how investors view companies like T. Rowe Price Group. This context helps explain why the stock's medium term track record over three years at 10.3% and five years, alongside more recent moves, is attracting closer attention from valuation focused investors.
- T. Rowe Price Group currently has a valuation score of 5 out of 6 based on six separate checks of potential undervaluation. The sections that follow will compare different valuation methods before closing with a more holistic way to think about what the stock might really be worth.
Approach 1: T. Rowe Price Group Excess Returns Analysis
The Excess Returns model asks a simple question: are shareholders earning more on the company’s equity than the return they might reasonably expect for the risk they are taking? If so, what is that stream of “extra” return worth today?
For T. Rowe Price Group, the model starts with Book Value of $50.16 per share and a Stable EPS estimate of $8.82 per share, based on weighted future Return on Equity estimates from 4 analysts. That implies an Average Return on Equity of 17.23%. Against a Cost of Equity of $3.98 per share, the implied Excess Return is $4.84 per share. The analysis also uses a Stable Book Value of $51.17 per share, sourced from weighted future Book Value estimates from 2 analysts.
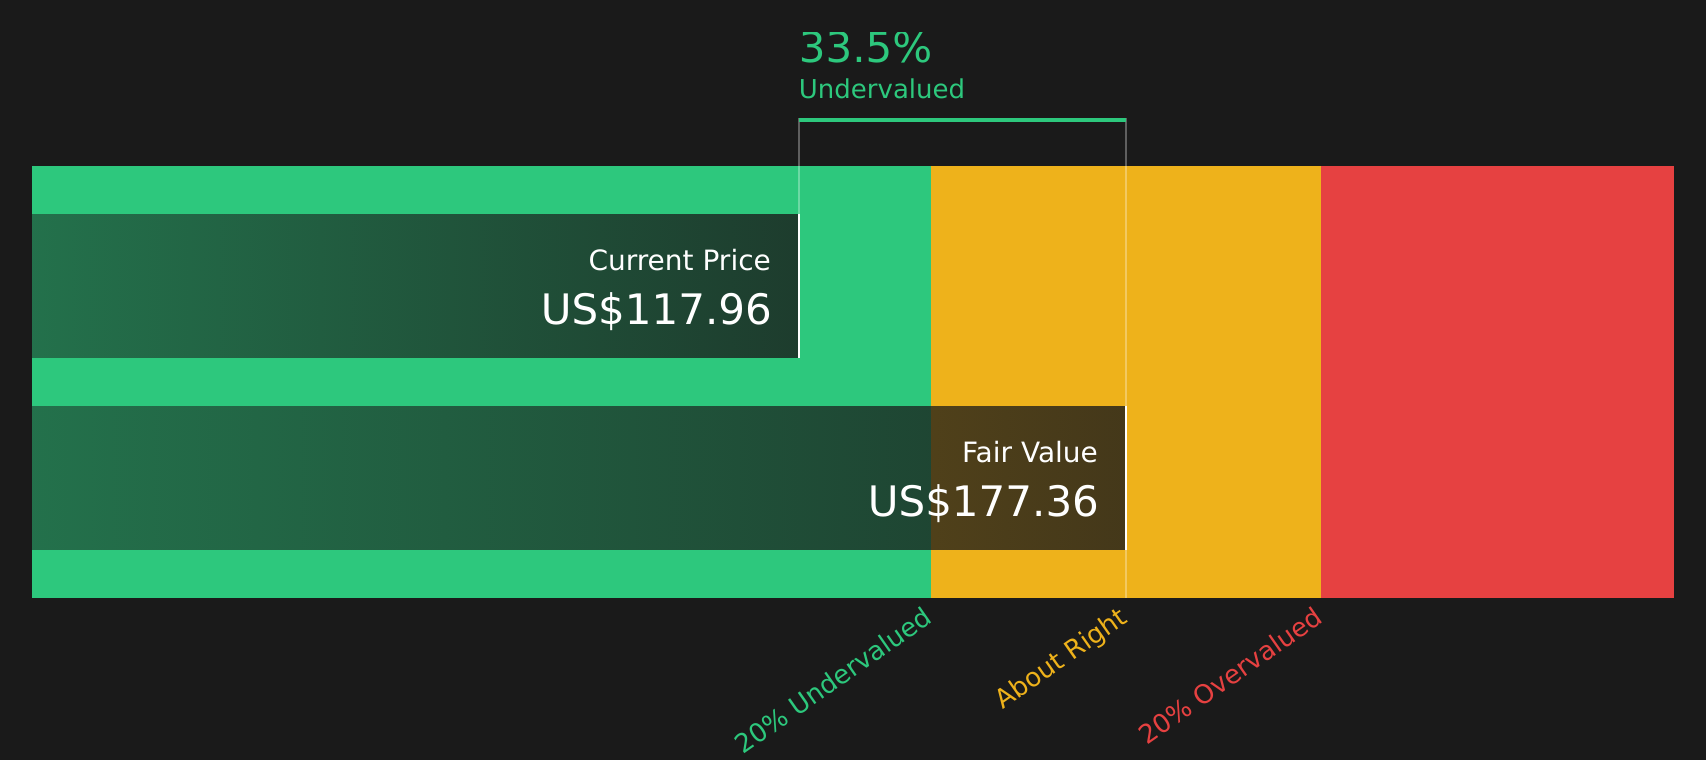
By capitalizing these excess returns, the Excess Returns model arrives at an intrinsic value of about $165.30 per share. Compared with the recent share price around $103.55, this implies the stock is 37.4% undervalued on this measure.
Result: UNDERVALUED
Our Excess Returns analysis suggests T. Rowe Price Group is undervalued by 37.4%. Track this in your watchlist or portfolio, or discover 46 more high quality undervalued stocks.
Approach 2: T. Rowe Price Group Price vs Earnings
For a consistently profitable company, the P/E ratio is a useful way to think about what you are paying for each dollar of earnings. A higher P/E usually reflects stronger growth expectations or lower perceived risk, while a lower P/E can suggest more modest growth expectations or higher perceived risk.
T. Rowe Price Group is currently trading on a P/E of 10.85x. This sits well below the Capital Markets industry average P/E of 39.81x and below the peer average of 33.17x. On the surface, that gap can hint at a discount, but headline comparisons do not account for differences in growth, profitability or risk.
Simply Wall St’s Fair Ratio for T. Rowe Price Group is 12.93x. This is a proprietary estimate of what a “normal” P/E could look like for this stock given its earnings growth profile, industry, profit margins, market capitalization and risk factors. Because it is tailored to the company’s own metrics rather than broad group averages, the Fair Ratio can be a more targeted guide than simple industry or peer comparisons. With the Fair Ratio above the current 10.85x P/E, the stock appears undervalued on this measure.
Result: UNDERVALUED

P/E ratios tell one story, but what if the real opportunity lies elsewhere? Start investing in legacies, not executives. Discover our 21 top founder-led companies.
Upgrade Your Decision Making: Choose your T. Rowe Price Group Narrative
Earlier it was mentioned that there is an even better way to understand valuation, so think of a Narrative as your own clear story for T. Rowe Price Group that links what you believe about its products, competition, flows and fees to a set of numbers, including future revenue, earnings, margins and a fair value estimate that can be compared directly with the current share price.
On Simply Wall St’s Community page, Narratives are an easy to use tool that let you set these assumptions, see the implied fair value, then update that view automatically when new information such as earnings or news comes through, so your story and numbers stay in sync.
For example, one Narrative for T. Rowe Price Group might line up with the more optimistic fair value of US$107.00 that assumes revenue growth of 2.6% a year and profit margins at 28.7%. Another Narrative could sit closer to the more cautious US$79.23 fair value that uses flat earnings of about US$2.0b and a P/E of 10.9x. Comparing each Narrative’s fair value with today’s price can help you decide where the stock sits relative to your own buy, hold or sell range.
For T. Rowe Price Group, here are previews of two leading T. Rowe Price Group Narratives:
Fair value in this bullish narrative: US$107.00 per share
Implied discount to this fair value compared with the recent US$103.55 share price: about 3.2% undervalued
Revenue growth assumption: 2.63% a year
- Focuses on ETFs, alternative investments and retirement products as key drivers for assets under management and fee revenue.
- Builds in analyst expectations for earnings of about US$2.3b by 2029, slightly higher profit margins and modest share count reduction.
- Flags risks around 2024 net outflows of US$43.2b, fee compression and a competitive market that could pressure revenue and margins.
Fair value in this more cautious narrative: US$96.50 per share
Implied premium to this fair value compared with the recent US$103.55 share price: about 7.3% overvalued
Revenue growth assumption: 2.06% a year
- Leans on modest revenue growth, slightly lower profit margins and a P/E of 11.4x by 2029 to support a fair value close to the analyst consensus.
- Highlights fee pressure, ongoing net outflows from higher fee active products and reliance on U.S. retail and retirement channels as key constraints.
- Points to competition from low cost products and new technology driven platforms as longer term challenges for fees, market share and profitability.
If you want to see how other investors are connecting these assumptions to their own price ranges and risk views, See what the community is saying about T. Rowe Price Group.
Do you think there's more to the story for T. Rowe Price Group? Head over to our Community to see what others are saying!

This article by Simply Wall St is general in nature. We provide commentary based on historical data and analyst forecasts only using an unbiased methodology and our articles are not intended to be financial advice. It does not constitute a recommendation to buy or sell any stock, and does not take account of your objectives, or your financial situation. We aim to bring you long-term focused analysis driven by fundamental data. Note that our analysis may not factor in the latest price-sensitive company announcements or qualitative material. Simply Wall St has no position in any stocks mentioned.