Is It Time To Revisit MarketAxess (MKTX) After A Year Of Share Price Weakness
MarketAxess Holdings Inc. MKTX | 171.46 | +3.53% |
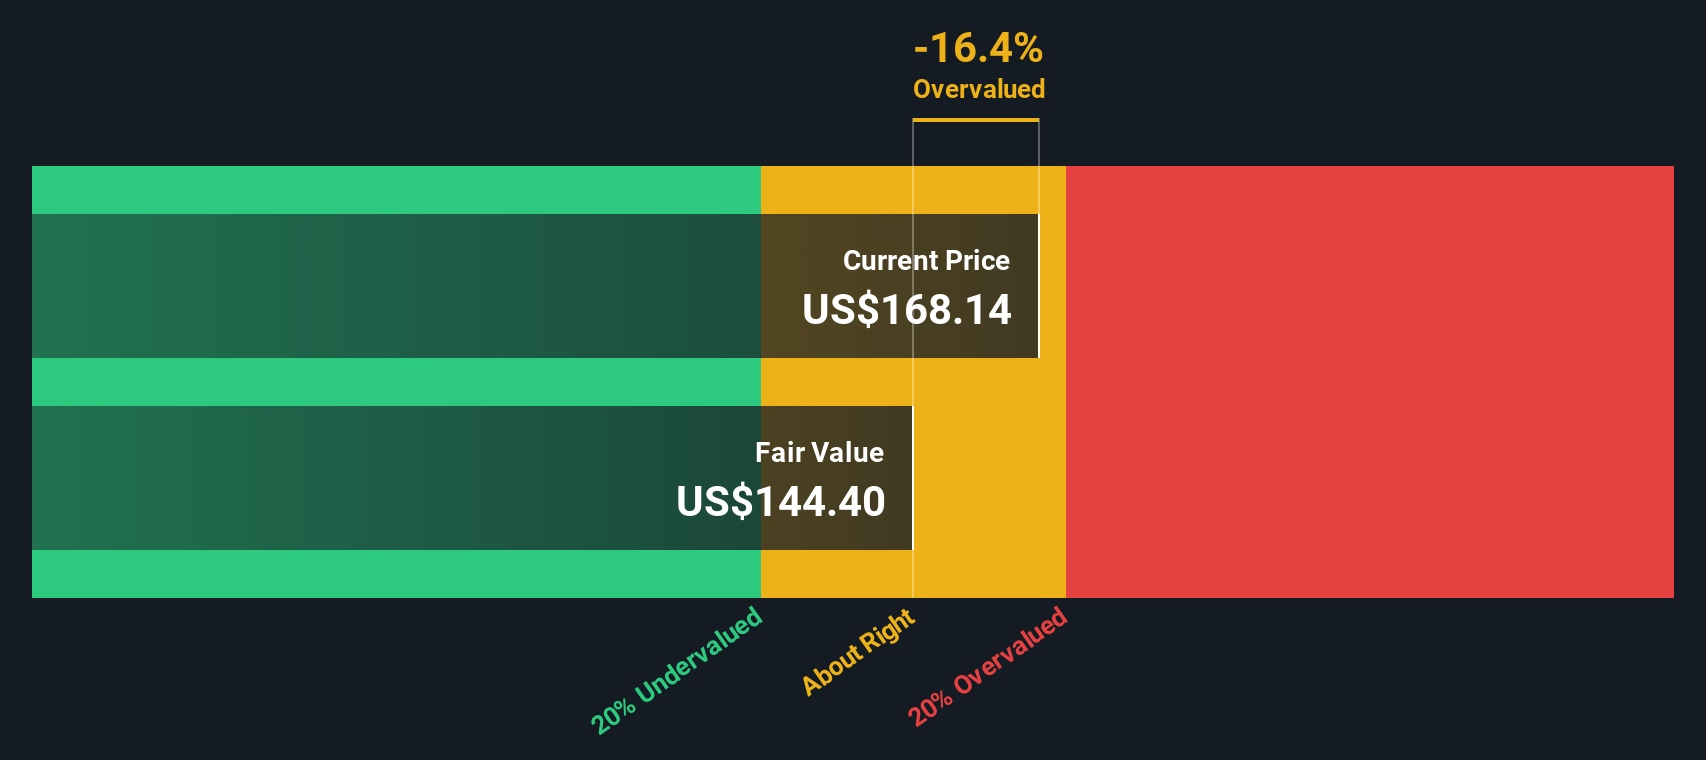
- If you are wondering whether MarketAxess Holdings at around US$169 per share is starting to look interesting, you are not alone in questioning what a fair price really looks like.
- The stock has seen a 1.3% decline over the last 7 days, a 5.2% decline over the last 30 days and is down 5.2% year to date and 22.1% over the last year. This naturally raises questions about how much risk and potential are now reflected in the price.
- Over the past three years, the share price return of 49.1% and the five year return of 68.7% highlight a long stretch of pressure on the stock. This can change how investors think about what they are willing to pay. This kind of longer term weakness often prompts a closer look at whether sentiment has moved further than the underlying business.
- Right now MarketAxess has a valuation score of 1 out of 6. We will walk through what different valuation approaches say about the stock and then finish with a way to think about value that goes beyond any single metric.
MarketAxess Holdings scores just 1/6 on our valuation checks. See what other red flags we found in the full valuation breakdown.
Approach 1: MarketAxess Holdings Excess Returns Analysis
The Excess Returns model looks at how much profit a company is expected to earn above the return that equity investors require, then capitalizes those extra profits into an intrinsic value per share.
For MarketAxess Holdings, the model uses a Book Value of $37.11 per share and a Stable EPS of $10.78 per share, based on weighted future Return on Equity estimates from 6 analysts. The Average Return on Equity is 25.11%, compared with a Cost of Equity of $3.44 per share. That gap translates into an Excess Return of $7.35 per share, which is the core driver of value in this framework.
The Stable Book Value is $42.94 per share, based on weighted future Book Value estimates from 3 analysts. Putting these inputs together, the Excess Returns model arrives at an intrinsic value of about $197.90 per share. Compared with a share price around $169, this implies the stock is roughly 14.5% undervalued according to this method.
Result: UNDERVALUED
Our Excess Returns analysis suggests MarketAxess Holdings is undervalued by 14.5%. Track this in your watchlist or portfolio, or discover 873 more undervalued stocks based on cash flows.
Approach 2: MarketAxess Holdings Price vs Earnings
For a profitable company like MarketAxess, the P/E ratio is a useful quick check because it links what you pay for each share to the earnings that business is currently producing. It is a simple way to compare how the market is pricing one company against others that also generate earnings.
What counts as a normal or fair P/E ratio usually reflects how the market sees a company’s growth prospects and risk profile. Higher expected growth or lower perceived risk can support a higher P/E, while lower growth expectations or higher risk tend to line up with a lower multiple.
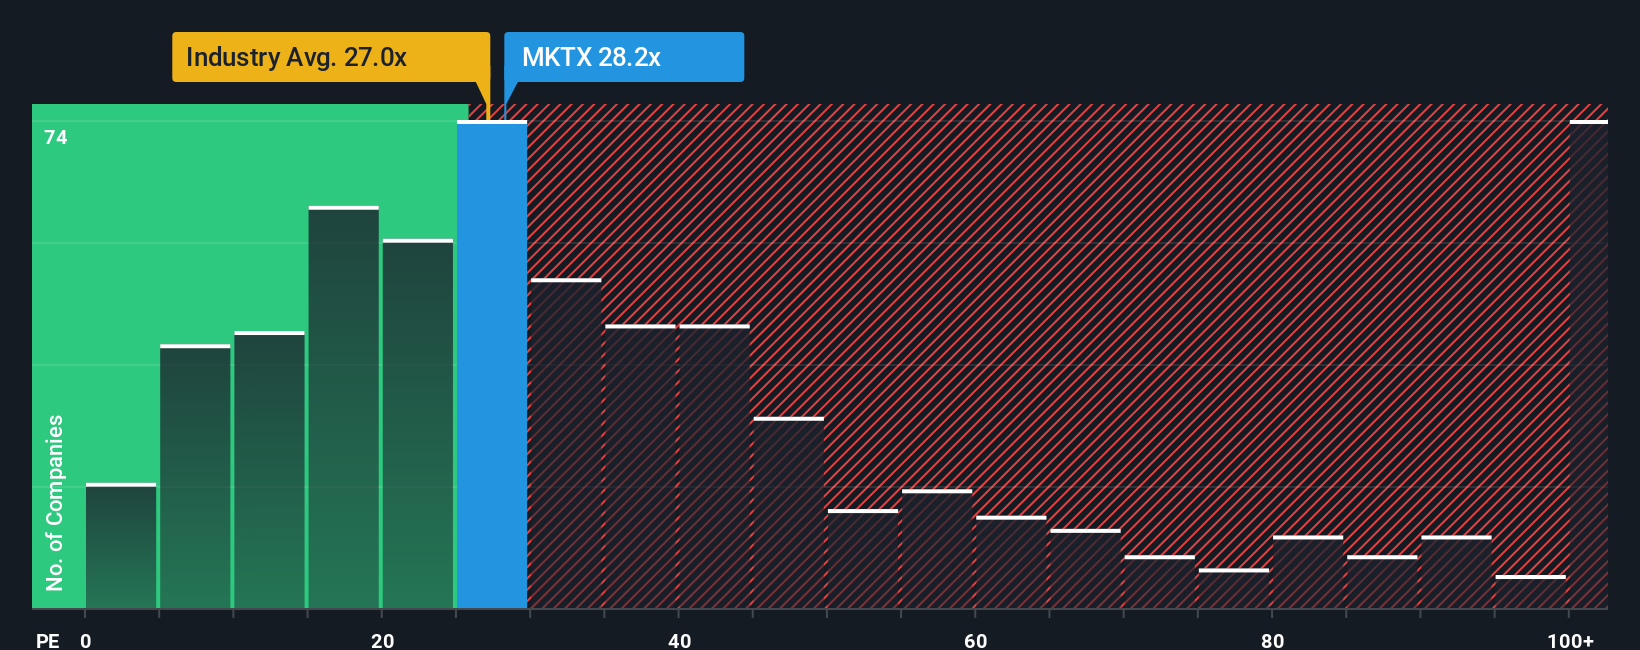
MarketAxess currently trades on a P/E of 28.65x. That sits above the Capital Markets industry average P/E of 23.62x and above the peer group average of 25.29x. Simply Wall St’s “Fair Ratio” for MarketAxess is 15.20x. This proprietary metric estimates the P/E you might expect given factors such as earnings growth, profit margins, industry, market cap and company specific risks.
Because the Fair Ratio incorporates these fundamentals directly, it can be more tailored than a simple comparison with peers or the broad industry. Set against the current P/E of 28.65x, the Fair Ratio of 15.20x points to MarketAxess trading above what this framework would suggest.
Result: OVERVALUED
P/E ratios tell one story, but what if the real opportunity lies elsewhere? Discover 1422 companies where insiders are betting big on explosive growth.
Upgrade Your Decision Making: Choose your MarketAxess Holdings Narrative
Earlier we mentioned that there is an even better way to understand valuation, so let us introduce you to Narratives, which are simply your own story about MarketAxess that connects what you believe about its business to numbers like future revenue, earnings, margins and a fair value estimate.
On Simply Wall St, Narratives live on the Community page and give you a straightforward way to link a company’s story to a financial forecast, then to a fair value that you can compare with the current share price to decide whether you see it as an opportunity or something to avoid right now.
Because Narratives on the platform are updated when fresh information comes in, such as earnings releases or major news, your view of MarketAxess is not frozen. It can adapt as the facts change while still keeping your original logic visible.
For example, one MarketAxess Narrative might assume very optimistic revenue growth and margins that point to a fair value well above the current price. Another more cautious Narrative might use lower growth and margin assumptions that lead to a fair value well below where the stock trades today, showing how two investors can look at the same company and reach very different conclusions.
Do you think there's more to the story for MarketAxess Holdings? Head over to our Community to see what others are saying!

This article by Simply Wall St is general in nature. We provide commentary based on historical data and analyst forecasts only using an unbiased methodology and our articles are not intended to be financial advice. It does not constitute a recommendation to buy or sell any stock, and does not take account of your objectives, or your financial situation. We aim to bring you long-term focused analysis driven by fundamental data. Note that our analysis may not factor in the latest price-sensitive company announcements or qualitative material. Simply Wall St has no position in any stocks mentioned.