Is It Time To Revisit Rithm Capital (RITM) After Recent Share Price Weakness?
Rithm Capital Corp. RITM | 0.00 |
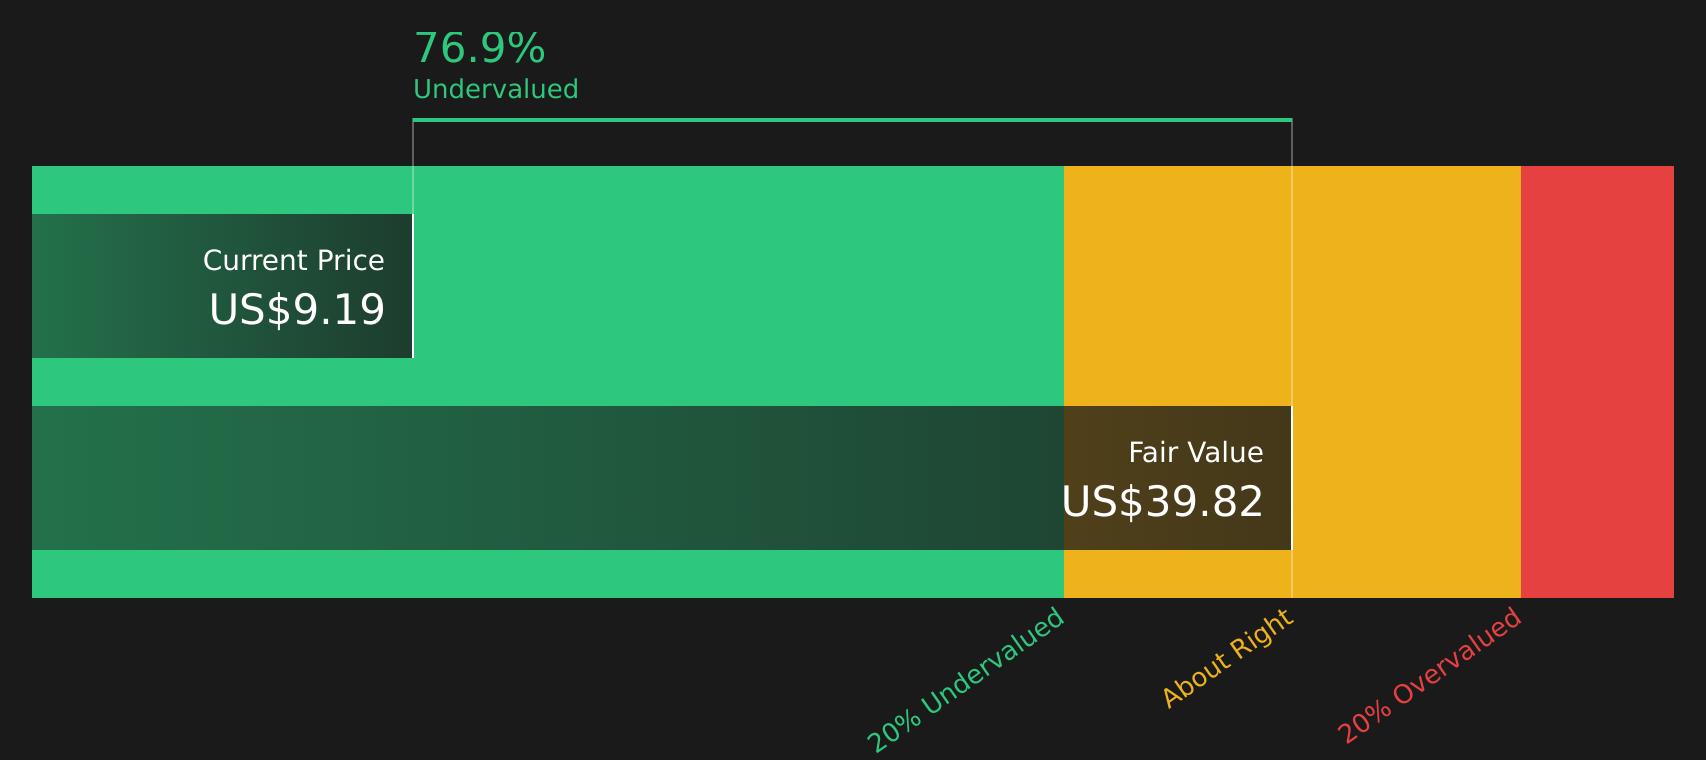
- If you are wondering whether Rithm Capital at around US$9.79 is a bargain or a value trap, the starting point is understanding what the current price actually reflects.
- The stock has recent returns of 0.1% over 7 days, 3.1% over 30 days, a 10.8% decline year to date, a 4.7% decline over 1 year, 64.2% over 3 years and 59.1% over 5 years. This gives you a mixed picture of short term weakness against longer term gains.
- Recent headlines have focused on Rithm Capital's positioning within diversified financials and its activity in the mortgage and real estate finance space. This shapes how investors think about both income potential and credit risk. This context helps explain why some traders focus on shorter term sentiment while others look at the longer multi year track record.
- Rithm Capital currently scores 6 out of 6 on a valuation check framework. The next step is to walk through the standard valuation approaches before finishing with a way of thinking about value that can tie all of these methods together.
Approach 1: Rithm Capital Excess Returns Analysis
The Excess Returns model looks at how much profit a company can generate above the return that shareholders require, based on its equity. Instead of focusing on cash flow, it asks whether each dollar of equity is expected to earn more than the cost of that equity over time.
For Rithm Capital, the starting point is an estimated Book Value of $12.51 per share and a Stable EPS of $2.64 per share, based on weighted future Return on Equity estimates from 4 analysts. The model applies a Cost of Equity of $1.28 per share, implying an Excess Return of $1.35 per share. That sits on top of an Average Return on Equity of 18.49% and a projected Stable Book Value of $14.25 per share, also sourced from 4 analysts' book value estimates.
Feeding these inputs into the Excess Returns framework produces an estimated intrinsic value of about $38.98 per share. Compared with the current share price around $9.79, the model indicates that the stock is trading at a discount of roughly 74.9% on this method.
Result: UNDERVALUED
Our Excess Returns analysis suggests Rithm Capital is undervalued by 74.9%. Track this in your watchlist or portfolio, or discover 51 more high quality undervalued stocks.
Approach 2: Rithm Capital Price vs Earnings
P/E is a common way to value profitable companies because it links what you pay directly to the earnings the company generates per share. In general, higher growth expectations and lower perceived risk can support a higher P/E, while slower growth or higher risk tend to justify a lower multiple.
Rithm Capital currently trades on a P/E of 9.13x. That sits below the Mortgage REITs industry average P/E of 12.05x and well below the broader peer average of 18.04x. This suggests the stock is priced more cautiously than many similar companies.
Simply Wall St’s Fair Ratio for Rithm Capital is 16.75x. This is a proprietary estimate of what a reasonable P/E might be for this stock, based on factors such as its earnings profile, industry, profit margins, market cap and specific risk characteristics. Because it adjusts for these company specific traits, the Fair Ratio can be more informative than a simple comparison with peers or an industry average that may include companies with very different risk and growth profiles.
Compared with the current P/E of 9.13x, the Fair Ratio of 16.75x suggests the stock is trading below what this framework considers a fair level.
Result: UNDERVALUED

P/E ratios tell one story, but what if the real opportunity lies elsewhere? Start investing in legacies, not executives. Discover our 18 top founder-led companies.
Upgrade Your Decision Making: Choose your Rithm Capital Narrative
Earlier it was mentioned that there is an even better way to understand valuation. Narratives bring that to life by letting you set a simple story for Rithm Capital, link it to your own assumptions for future revenue, earnings and margins, and then turn that into a Fair Value you can compare with the current price on Simply Wall St’s Community page. This is where millions of investors share their views and each Narrative updates automatically as fresh news or earnings arrive. For example, one investor might build a more optimistic Rithm Capital Narrative using the higher analyst price target of US$16.00, while another uses the lower target of US$12.50 to reflect a more cautious view. Both can quickly see whether their story suggests the stock looks expensive or cheap next to today’s US$9.79 price.
Do you think there's more to the story for Rithm Capital? Head over to our Community to see what others are saying!

This article by Simply Wall St is general in nature. We provide commentary based on historical data and analyst forecasts only using an unbiased methodology and our articles are not intended to be financial advice. It does not constitute a recommendation to buy or sell any stock, and does not take account of your objectives, or your financial situation. We aim to bring you long-term focused analysis driven by fundamental data. Note that our analysis may not factor in the latest price-sensitive company announcements or qualitative material. Simply Wall St has no position in any stocks mentioned.