Is It Too Late To Consider American Express (AXP) After A Strong Multi Year Rally?
American Express Company AXP | 300.18 | -0.11% |
- If you are wondering whether American Express is still good value after a strong multi year run, this article walks through what the current price might be implying about the stock.
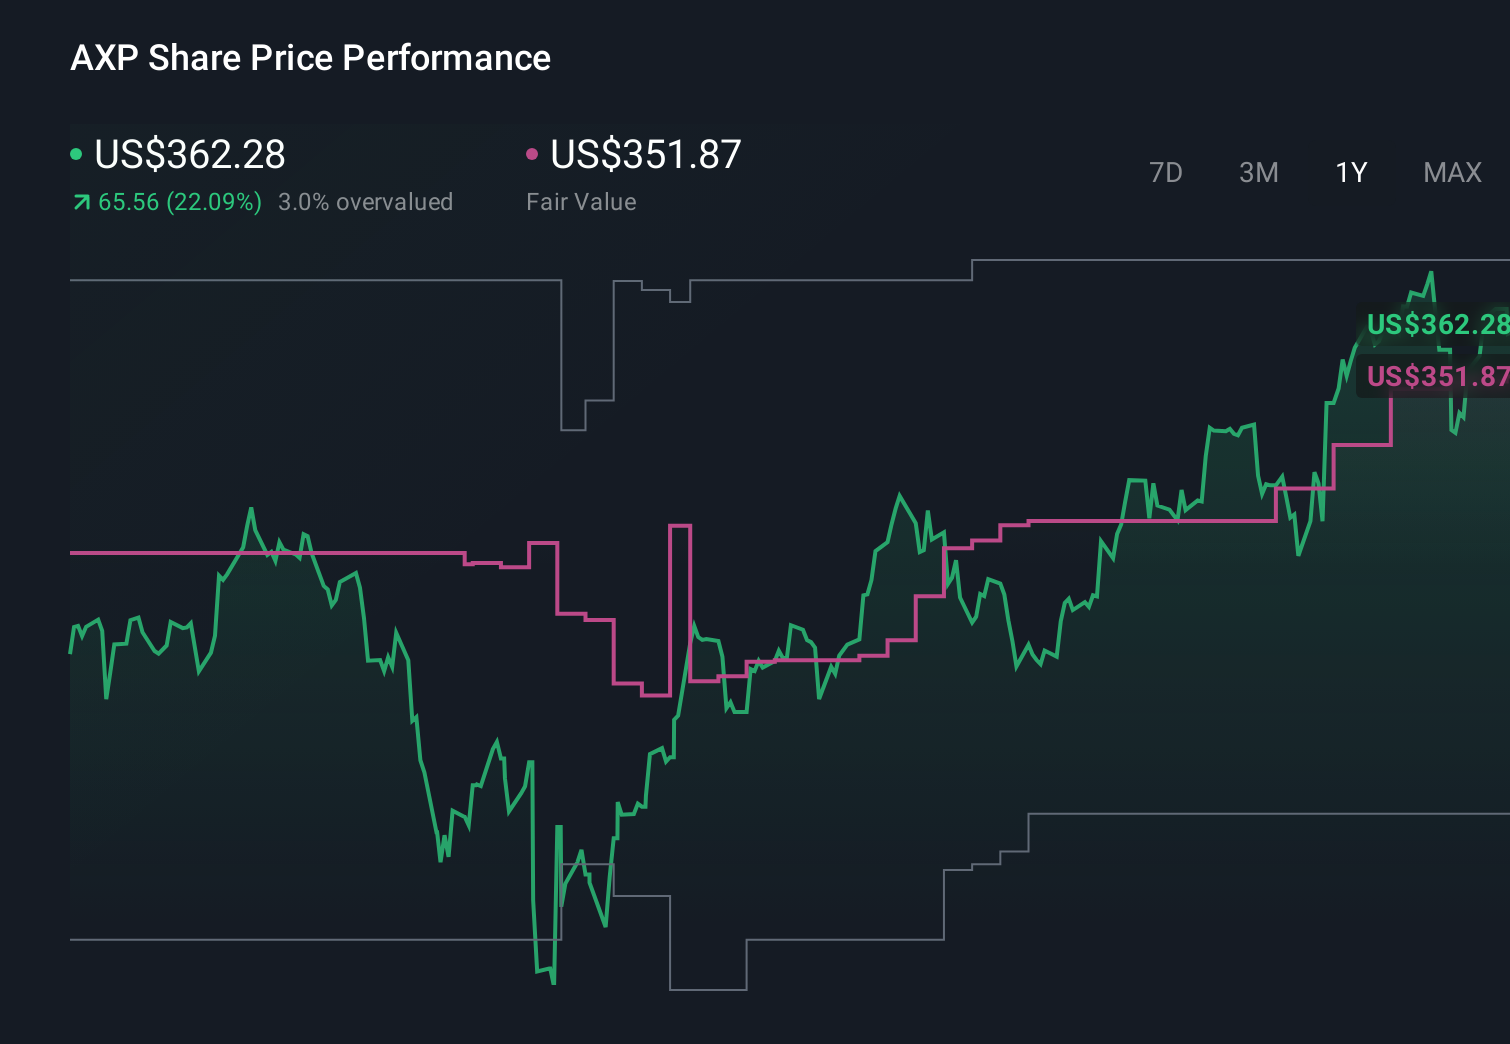
- At a last close of US$352.19, the stock has had a 1.6% decline over 7 days and a 6.5% decline over 30 days, although it still shows returns of 11.9% over 1 year, 135.1% over 3 years and 222.1% over 5 years.
- Recent news flow around American Express has largely focused on its position in payments and card spending trends, as investors weigh how consumer behavior and business travel are shaping expectations for the brand. This context helps explain why the share price has recently cooled after strong multi year returns, as the market reassesses what is already priced in.
- American Express currently has a valuation score of 2 out of 6, based on checks of whether it is undervalued. Next, we will look at what different valuation methods say about that score and why there may be an even better way to interpret value by the end of this article.
American Express scores just 2/6 on our valuation checks. See what other red flags we found in the full valuation breakdown.
Approach 1: American Express Excess Returns Analysis
The Excess Returns model looks at how much profit a company can generate above its estimated cost of equity, then capitalizes those surplus returns into a per share value. It focuses less on near term earnings and more on how efficiently each dollar of shareholder capital is used over time.
For American Express, the model starts with a Book Value of $47.05 per share and a Stable EPS estimate of $20.34 per share, based on weighted future Return on Equity estimates from 9 analysts. The implied Average Return on Equity is 37.50%, compared with a Cost of Equity of $4.53 per share. That gap produces an Excess Return of $15.80 per share, which is then applied to a Stable Book Value of $54.23 per share, sourced from 7 analysts.
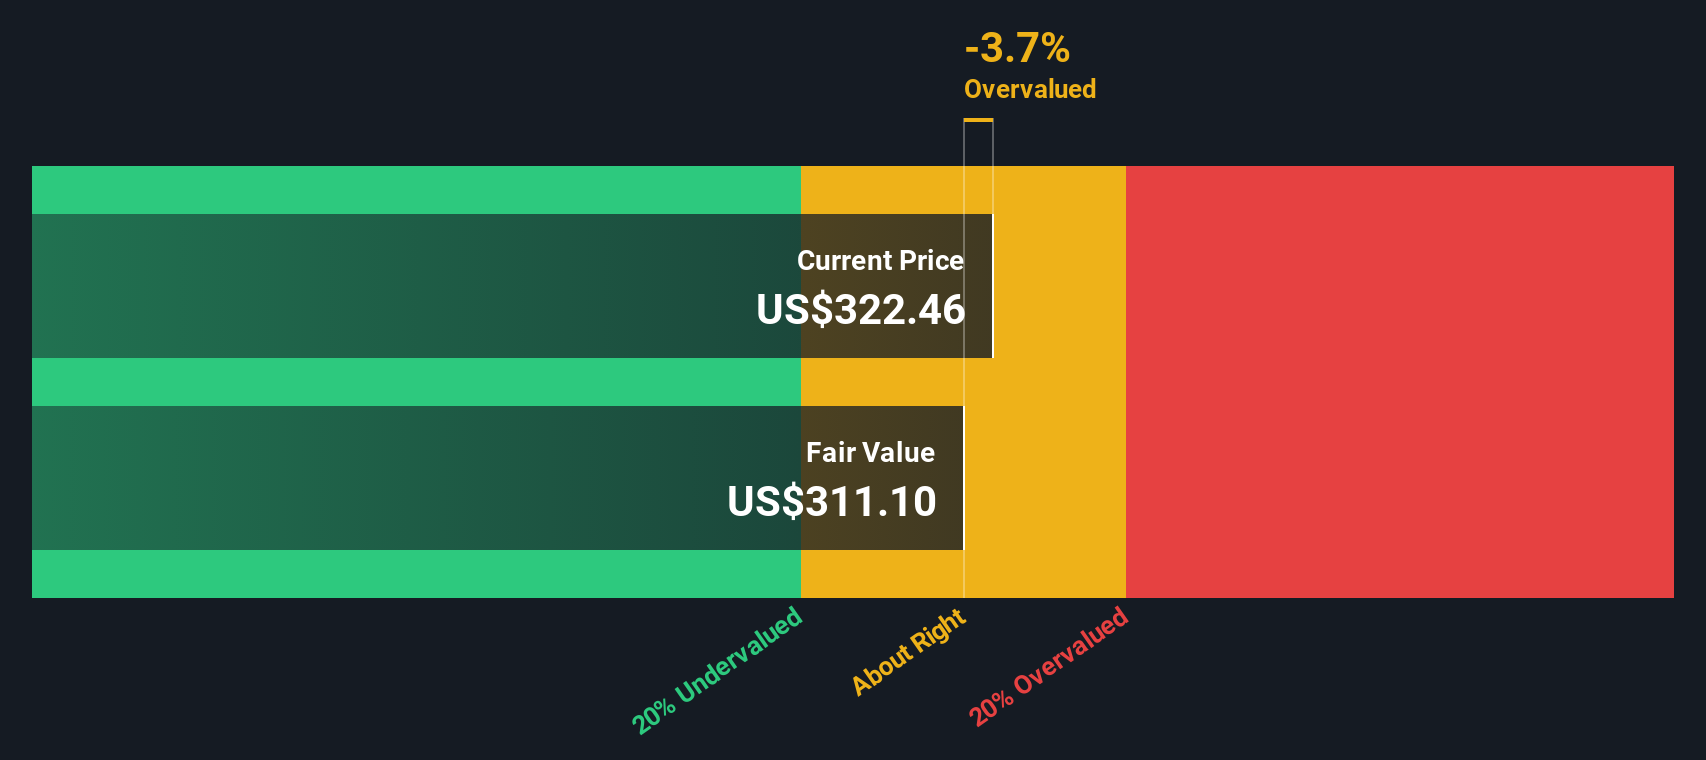
Putting this together, the Excess Returns model arrives at an intrinsic value of about $364.08 per share. This implies the shares are around 3.3% undervalued versus the recent price of $352.19. That is a small gap, so this framework is signaling that American Express appears broadly in line with its modeled value today.
Result: ABOUT RIGHT
American Express is fairly valued according to our Excess Returns, but this can change at a moment's notice. Track the value in your watchlist or portfolio and be alerted on when to act.
Approach 2: American Express Price vs Earnings
For a profitable company like American Express, the P/E ratio is a practical way to think about value because it directly links what you pay for the stock to the earnings the business is already generating.
What counts as a “normal” or “fair” P/E depends on how quickly earnings are expected to grow and how risky those earnings might be. Higher growth or lower perceived risk can justify a higher P/E, while slower growth or higher risk usually calls for a lower one.
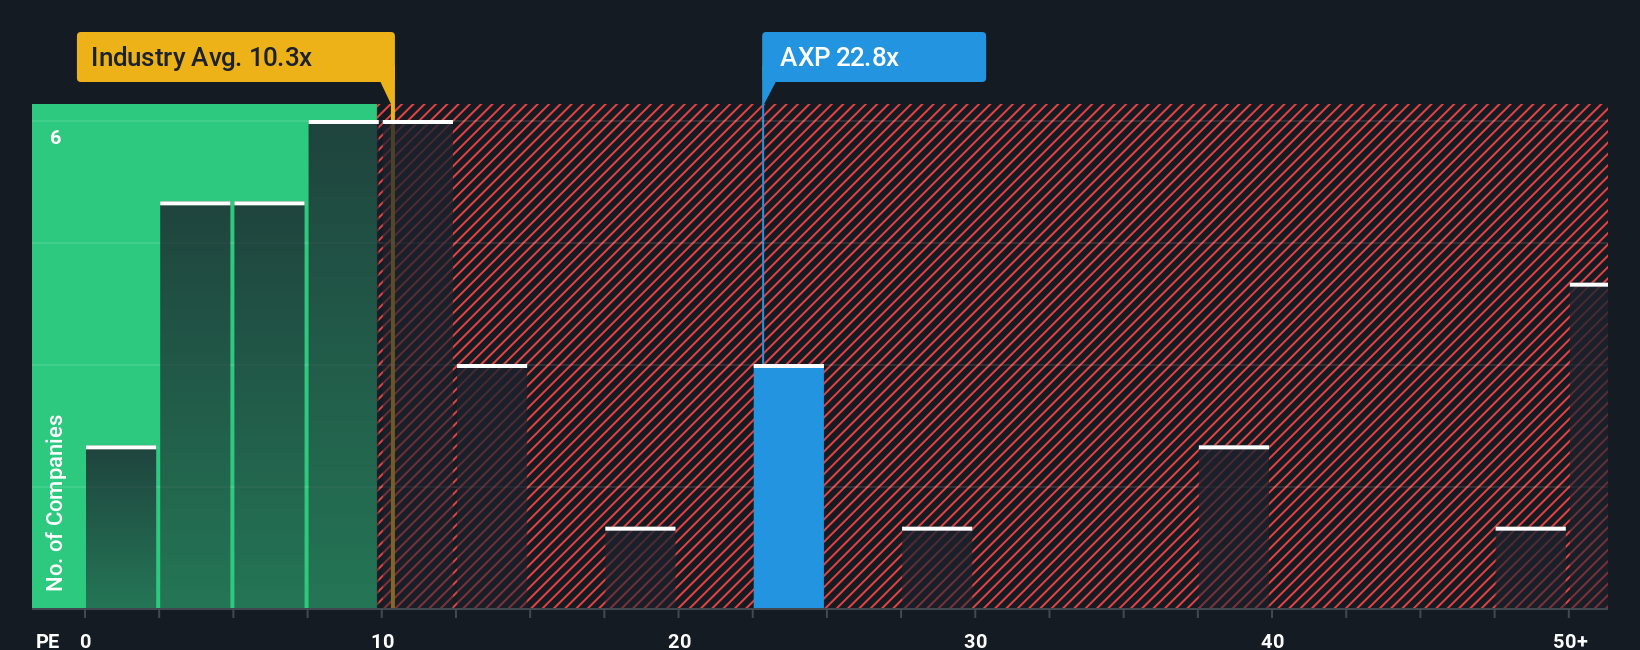
American Express currently trades on a P/E of 23.30x. That is above the Consumer Finance industry average P/E of 8.98x, but below the peer group average of 25.13x. Simply Wall St’s Fair Ratio for American Express is 20.39x, which is its proprietary estimate of what the P/E “should” be after factoring in elements like earnings growth, profit margins, industry, market cap and company specific risks.
This Fair Ratio is more tailored than a simple peer or industry comparison because it adjusts for the specific profile of American Express rather than assuming all companies deserve similar multiples. With the current P/E at 23.30x versus a Fair Ratio of 20.39x, the shares screen as somewhat expensive on this metric.
Result: OVERVALUED
P/E ratios tell one story, but what if the real opportunity lies elsewhere? Discover 1446 companies where insiders are betting big on explosive growth.
Upgrade Your Decision Making: Choose your American Express Narrative
Earlier we mentioned that there is an even better way to understand valuation, so let us introduce you to Narratives. These let you connect your view of American Express’s story to your own revenue, earnings and margin estimates, turn that into a Fair Value, and then compare it with today’s share price inside Simply Wall St’s Community page. Narratives are kept up to date as new news or earnings arrive. You can see, for example, how one investor might build a more optimistic American Express Narrative closer to a Fair Value of US$462.00, while another might anchor on a more cautious Fair Value of US$230.00, and use that gap versus the current price to decide whether the stock looks attractive or not based on their own assumptions.
For American Express however we will make it really easy for you with previews of two leading American Express Narratives:
Each one ties the same business to a different story about future growth, profitability and what a reasonable entry price might look like. Your job is to decide which story feels closer to how you see the company, or to use them as starting points for your own view.
Fair value: about US$354.83 per share
Implied pricing gap vs last close of US$352.19: roughly 0.7% undervalued using ((354.83 minus 352.19) divided by 354.83)
Revenue growth assumption: 10.28% a year
- Focuses on premium cardmembers, younger cohorts and the refreshed Platinum product as the key drivers of retention, fee income and long term earnings stability.
- Assumes steady double digit revenue growth and stable margins supported by disciplined credit risk management, strong returns on equity and ongoing buybacks.
- Flags competition, changing payment habits and slower international expansion as the main watchpoints that could challenge the thesis if they play out differently.
Fair value: US$230.00 per share
Implied pricing gap vs last close of US$352.19: about 53.1% overvalued using ((352.19 minus 230.00) divided by 230.00)
Revenue growth assumption: 8.99% a year
- Centers on slower travel and entertainment spend, higher reward costs and pressure on small business customers as potential drags on revenue and margins.
- Builds in slightly lower growth and margin compression, along with a lower future P/E, which together point to a much lower fair value than today’s share price.
- Acknowledges that strong spend from a premium customer base, high retention and international diversification could still support steady results, which would weaken the bearish case.
Both narratives are built from the same company level data but they stress different parts of the story and use different assumptions on growth, margins and the P/E that might apply in future. Lining them up against the current price can help you decide which set of assumptions feels more realistic to you and where you would be comfortable engaging with the stock.
Do you think there's more to the story for American Express? Head over to our Community to see what others are saying!
This article by Simply Wall St is general in nature. We provide commentary based on historical data and analyst forecasts only using an unbiased methodology and our articles are not intended to be financial advice. It does not constitute a recommendation to buy or sell any stock, and does not take account of your objectives, or your financial situation. We aim to bring you long-term focused analysis driven by fundamental data. Note that our analysis may not factor in the latest price-sensitive company announcements or qualitative material. Simply Wall St has no position in any stocks mentioned.