Is It Too Late To Consider Amkor Technology (AMKR) After Its 99% One Year Rally?
Amkor Technology, Inc. AMKR | 46.70 | +0.45% |
- If you are wondering whether Amkor Technology's current share price still offers value, this article will walk through what the market is pricing in and how that lines up with the fundamentals.
- The stock most recently closed at US$48.33, with a 7 day return of a 2.8% decline, a 30 day return of 22.4%, a year to date return of 12.6%, a 1 year return of 99.2%, a 3 year return of 68.1% and a 5 year return of 189.8%.
- These movements sit against a steady flow of attention on semiconductor related names, including ongoing interest from investors tracking the sector and its suppliers. This context matters for Amkor Technology because sentiment around chip demand and supply chains can quickly influence how the market prices packaging and testing businesses.
- Amkor Technology currently has a valuation score of 3/6, reflecting where it screens as undervalued on some checks and less so on others. Next, we will compare methods like DCF, multiples and more traditional yardsticks before finishing with a broader way to think about what valuation really means for you as an investor.
Approach 1: Amkor Technology Dividend Discount Model (DDM) Analysis
The Dividend Discount Model, or DDM, looks at a stock by projecting all future dividends and discounting them back into today’s dollars. It is most useful when a company’s dividend policy is relatively stable and supported by its earnings power.
For Amkor Technology, the model uses a current dividend per share of about US$0.36, a return on equity of 9.67% and a payout ratio of 20.26%. That payout level suggests the company is retaining most of its earnings, with room to support or adjust dividends if needed. The model applies a dividend growth rate of 3.26%, capped from an initially higher figure, together with an expected broader growth assumption of 7.71% to keep the projection conservative.
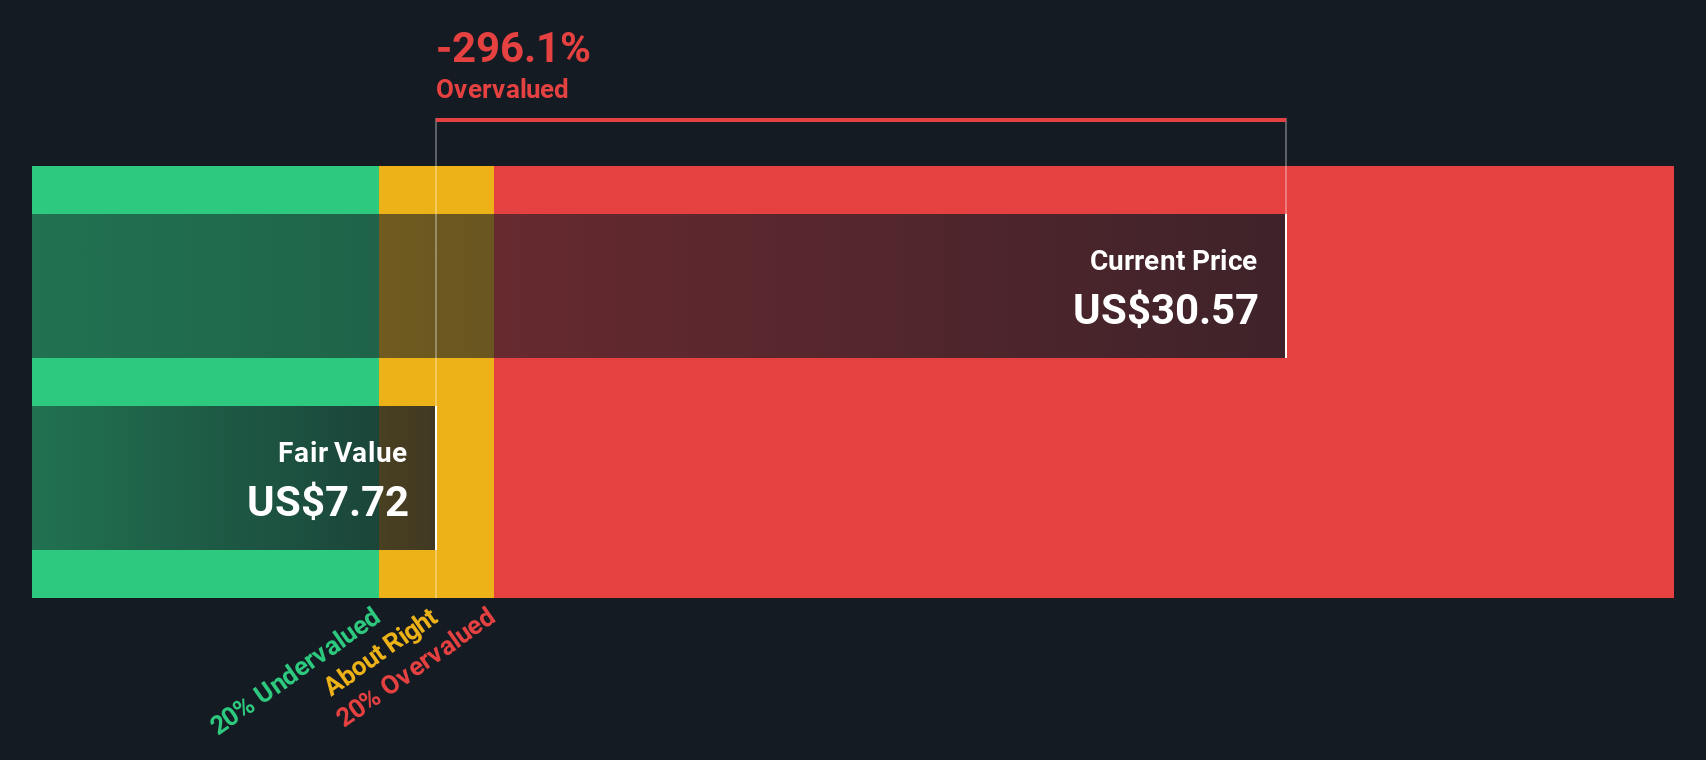
On these inputs, the DDM output is an estimated intrinsic value of roughly US$4.19 per share. Against the recent market price of US$48.33, the implied gap is very large, with the model indicating the shares are significantly overvalued based purely on projected dividends.
Result: OVERVALUED
Our Dividend Discount Model (DDM) analysis suggests Amkor Technology may be overvalued by 1053.6%. Discover 868 undervalued stocks or create your own screener to find better value opportunities.
Approach 2: Amkor Technology Price vs Earnings
For profitable companies, the P/E ratio is a simple way to link what you pay today to the earnings the business is already generating. It helps you see how many dollars of share price the market is assigning to each dollar of earnings.
What counts as a reasonable P/E depends on what investors expect for future growth and how risky those earnings appear. Higher expected growth or lower perceived risk can justify a higher P/E, while slower growth or higher risk usually points to a lower one.
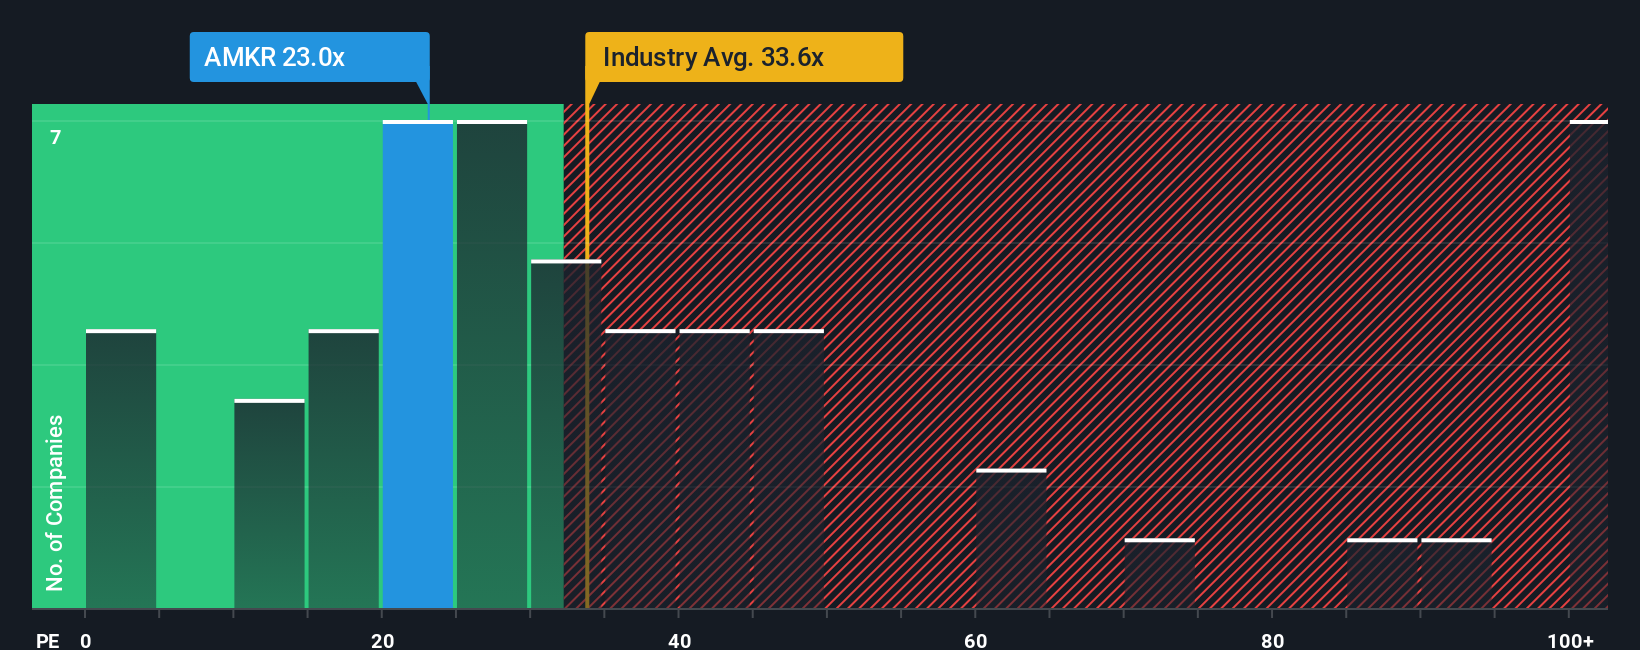
Amkor Technology currently trades on a P/E of 38.82x. That sits below the Semiconductor industry average of about 41.90x and below the peer group average of 57.85x. Simply Wall St also calculates a proprietary “Fair Ratio” of 41.18x, which reflects factors such as Amkor’s earnings profile, industry, profit margin, market cap and risk characteristics.
This Fair Ratio is more tailored than a simple peer or industry comparison because it adjusts for company specific traits rather than assuming all semiconductor names should trade at the same multiple. Comparing the Fair Ratio of 41.18x with the current P/E of 38.82x suggests Amkor Technology is slightly undervalued on this metric.
Result: UNDERVALUED
P/E ratios tell one story, but what if the real opportunity lies elsewhere? Discover 1417 companies where insiders are betting big on explosive growth.
Upgrade Your Decision Making: Choose your Amkor Technology Narrative
Earlier we mentioned that there is an even better way to understand valuation, so let us introduce you to Narratives, which are simply your story about a company, backed by your own fair value, revenue, earnings and margin estimates. A Narrative connects what you believe about Amkor Technology’s business to a clear financial forecast and then to a specific fair value, so you can see how your view translates into numbers. On Simply Wall St, millions of investors share these Narratives on the Community page, making it easy for you to compare different views without needing complex models.
Once you have a Narrative, you can compare its Fair Value to the current share price to help you decide whether the stock looks attractive, fully priced or expensive for your assumptions. Narratives also update automatically when new information such as earnings or news is added to the platform, so your fair value and thesis stay current without extra work. For example, one Amkor Technology Narrative might assume a lower fair value based on moderate revenue growth and margins, while another assumes a much higher fair value using stronger growth and profitability assumptions.
Do you think there's more to the story for Amkor Technology? Head over to our Community to see what others are saying!

This article by Simply Wall St is general in nature. We provide commentary based on historical data and analyst forecasts only using an unbiased methodology and our articles are not intended to be financial advice. It does not constitute a recommendation to buy or sell any stock, and does not take account of your objectives, or your financial situation. We aim to bring you long-term focused analysis driven by fundamental data. Note that our analysis may not factor in the latest price-sensitive company announcements or qualitative material. Simply Wall St has no position in any stocks mentioned.