Is It Too Late To Consider Archrock (AROC) After Its Recent Strong Share Price Run
Archrock Inc. AROC | 0.00 |
- Investors may be wondering whether Archrock's current share price reflects its true worth, or if the stock is starting to look stretched after a strong run.
- The stock finished the last session at US$36.80, with returns of 38.2% year to date and 47.2% over the past 12 months. However, it has fallen 5.9% over the last week and is roughly flat over the past month with a 0.9% gain.
- Recent coverage has focused on Archrock's position in energy infrastructure and how investors are reacting to sector wide themes. This helps explain some of the swings in sentiment around the stock. These headlines give useful colour on why the price has moved, even if they do not directly answer whether the current level is justified.
- Archrock currently has a value score of 3/6. The rest of this article will walk through what that score means across different valuation methods, and then finish with a more holistic way to think about what the stock might be worth.
Approach 1: Archrock Discounted Cash Flow (DCF) Analysis
A Discounted Cash Flow, or DCF, model estimates what a stock could be worth by projecting future cash flows and discounting them back to today to account for risk and the time value of money.
For Archrock, the model uses a 2 Stage Free Cash Flow to Equity approach. The latest twelve month free cash flow is about $215.5 million, and analyst inputs plus Simply Wall St extrapolations project free cash flow reaching around $357.1 million in 2035. These ten year projections range from $346.1 million in 2026 to that $357.1 million figure in 2035, with each future cash flow discounted back to today using the model's assumptions.
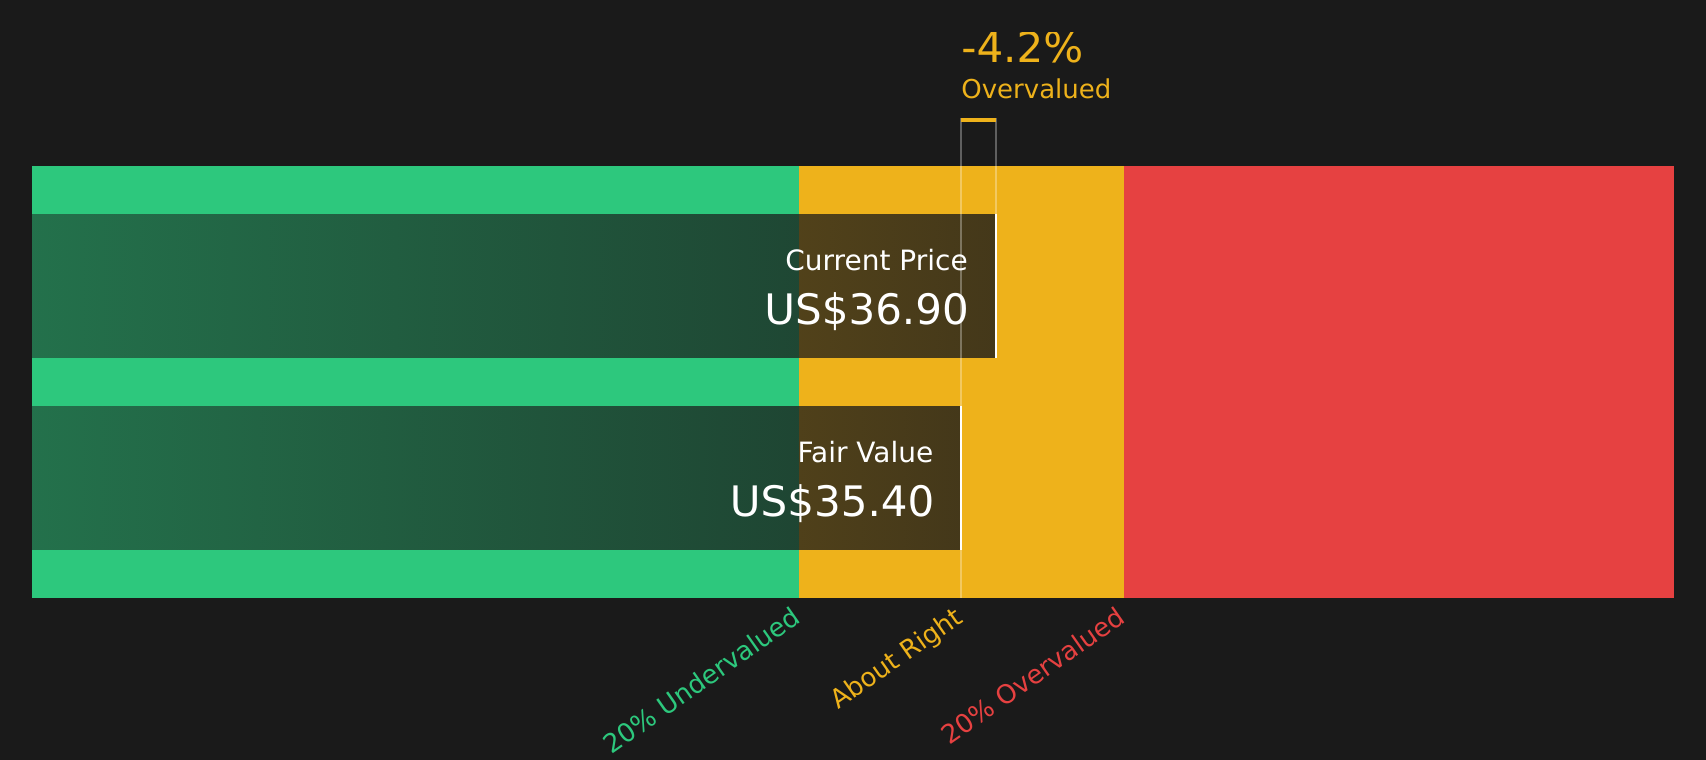
Adding these discounted cash flows together gives an estimated intrinsic value of about $35.54 per share. Compared with the recent share price of $36.80, the DCF output suggests Archrock is roughly 3.5% above this estimate, which points to a level that is quite close to the model's fair value range rather than strongly mispriced.
Result: ABOUT RIGHT
Archrock is fairly valued according to our Discounted Cash Flow (DCF), but this can change at a moment's notice. Track the value in your watchlist or portfolio and be alerted on when to act.
Approach 2: Archrock Price vs Earnings
For profitable companies like Archrock, the P/E ratio is a useful way to relate what you pay for each share to the earnings the business is currently generating. It lets you see how many dollars the market is willing to pay today for one dollar of annual earnings.
What counts as a “normal” P/E depends on what investors expect for future growth and how much risk they see in those earnings. Higher expected growth or lower perceived risk can support a higher P/E, while slower growth or higher risk tends to justify a lower one.
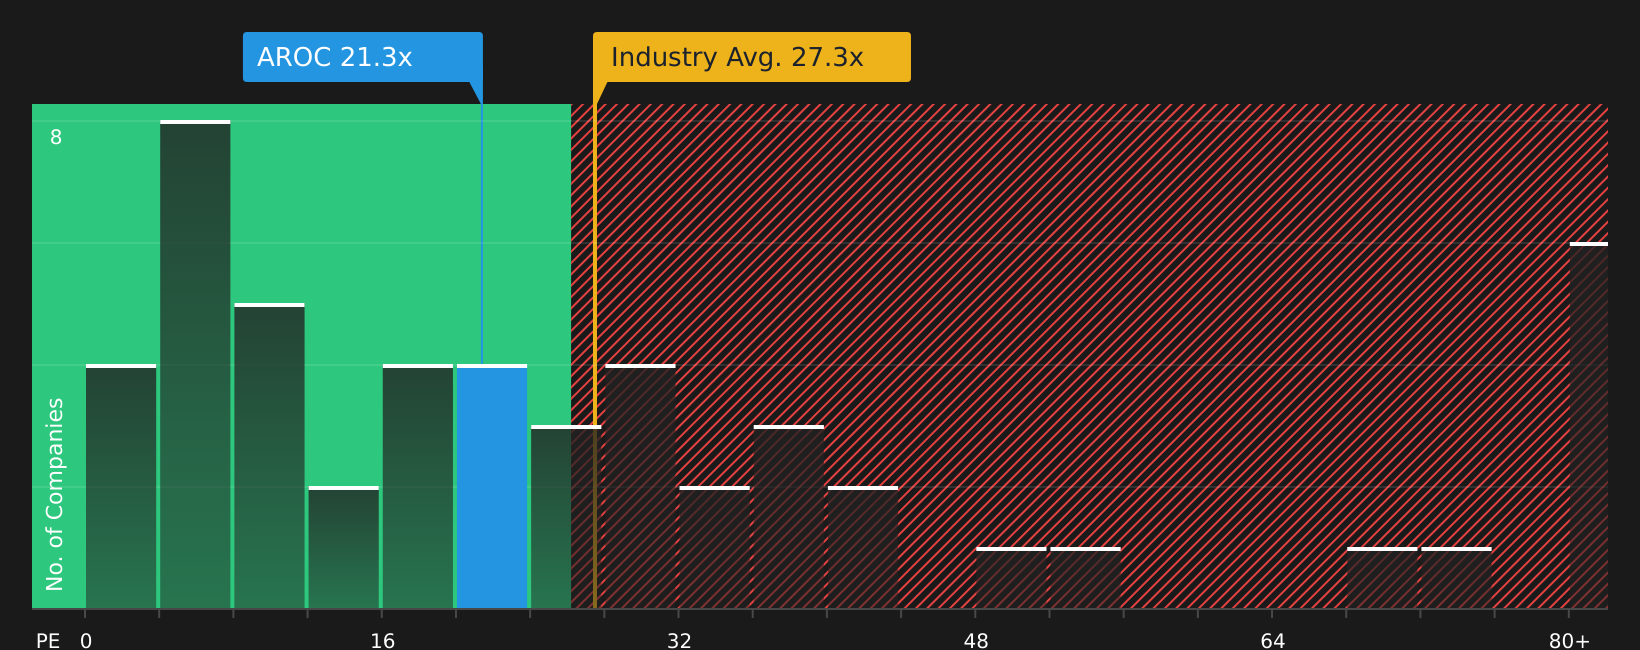
Archrock currently trades on a P/E of 20.06x, compared with the Energy Services industry average of 26.77x and a peer group average of 74.40x. Simply Wall St’s Fair Ratio for Archrock is 20.57x, which is a proprietary estimate of what the P/E might be given factors such as earnings growth, industry, profit margins, market cap and risk profile.
This Fair Ratio gives a more tailored view than a simple comparison with peers or the broad industry, because it adjusts for company specific characteristics rather than assuming all stocks deserve the same multiple. With the actual P/E of 20.06x sitting very close to the Fair Ratio of 20.57x, the shares look broadly in line with this earnings based model.
Result: ABOUT RIGHT
P/E ratios tell one story, but what if the real opportunity lies elsewhere? Start investing in legacies, not executives. Discover our 20 top founder-led companies.
Upgrade Your Decision Making: Choose your Archrock Narrative
Earlier it was mentioned that there is an even better way to understand valuation. Meet Narratives, a simple tool on Simply Wall St’s Community page that lets you connect your view of Archrock’s story to explicit revenue, earnings and margin forecasts. These then flow through to a fair value you can compare with the current share price to help decide if the stock looks attractive or expensive. Because these Narratives update automatically when fresh information such as news, earnings or buybacks is added, you can see in real time how different investors land on very different conclusions. For example, one Narrative might lean on the consensus fair value of US$39.67 based on assumptions like 5.5% annual revenue growth, a 21.9% profit margin and a 21.8x future P/E. Another might focus more on risks around U.S. natural gas exposure and regulatory change and therefore prefer more conservative forecasts and a lower fair value.
Do you think there's more to the story for Archrock? Head over to our Community to see what others are saying!

This article by Simply Wall St is general in nature. We provide commentary based on historical data and analyst forecasts only using an unbiased methodology and our articles are not intended to be financial advice. It does not constitute a recommendation to buy or sell any stock, and does not take account of your objectives, or your financial situation. We aim to bring you long-term focused analysis driven by fundamental data. Note that our analysis may not factor in the latest price-sensitive company announcements or qualitative material. Simply Wall St has no position in any stocks mentioned.