Is It Too Late To Consider Archrock (AROC) After Multi‑Year Share Price Surge?
Archrock Inc. AROC | 36.31 36.31 | -0.08% 0.00% Pre |
- If you are wondering whether Archrock's share price still offers value or if most of the opportunity is already priced in, you are not alone.
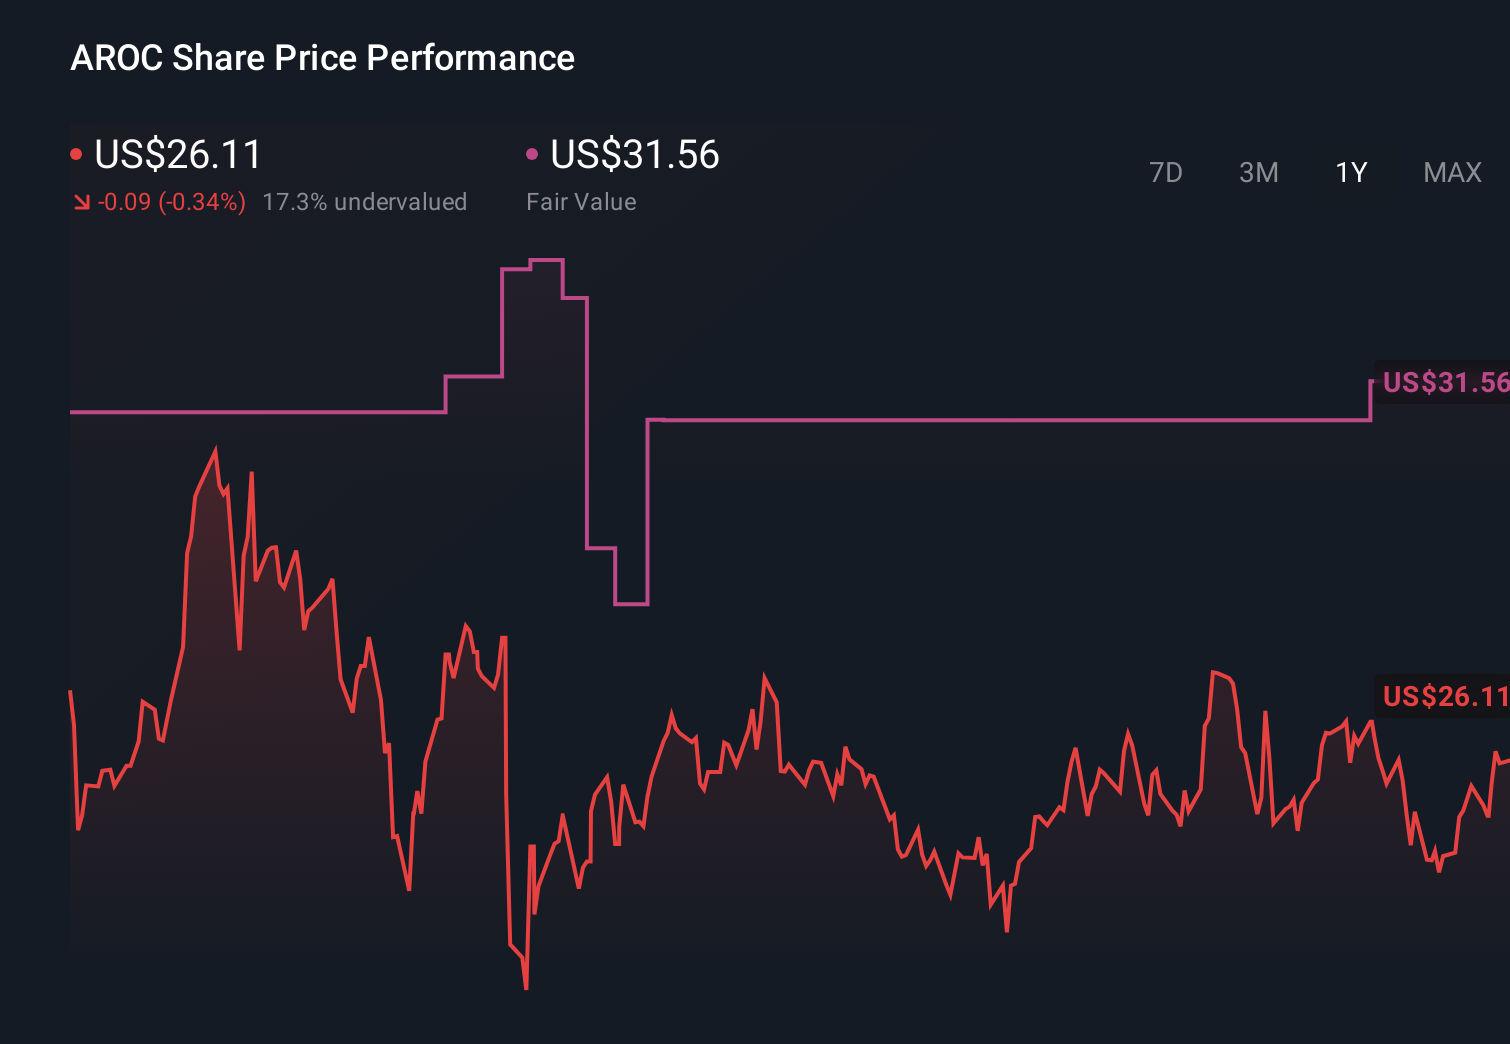
- The stock last closed at US$32.05, with returns of 8.3% over 7 days, 24.7% over 30 days, 20.4% year to date, 18.3% over 1 year, 274.6% over 3 years and 316.4% over 5 years. This naturally raises questions about what is driving these moves and what that might mean for risk.
- Recent coverage has focused on Archrock's position in the energy infrastructure space and how its compression services tie into longer term natural gas usage trends. This context is important for understanding why the market has been willing to reprice the shares over time, as investors weigh the durability of its business model against sector specific risks.
- Our valuation work currently gives Archrock a score of 4 out of 6, based on how it screens on a set of undervaluation checks. Next we will walk through what those approaches say about the stock and outline an even more complete way to think about value toward the end of the article.
Approach 1: Archrock Discounted Cash Flow (DCF) Analysis
A Discounted Cash Flow, or DCF, model looks at the cash Archrock is expected to generate in the future and discounts those projections back to today, to estimate what the business might be worth right now.
For Archrock, the model used is a 2 Stage Free Cash Flow to Equity approach, based on cash flow projections. The company’s last twelve months Free Cash Flow is about $60 million, and analyst plus extrapolated estimates point to Free Cash Flow of $449 million by 2030, with intermediate annual projections stepping up between 2026 and 2035. These future cash flows are all discounted back to today in dollars to arrive at an intrinsic value per share.
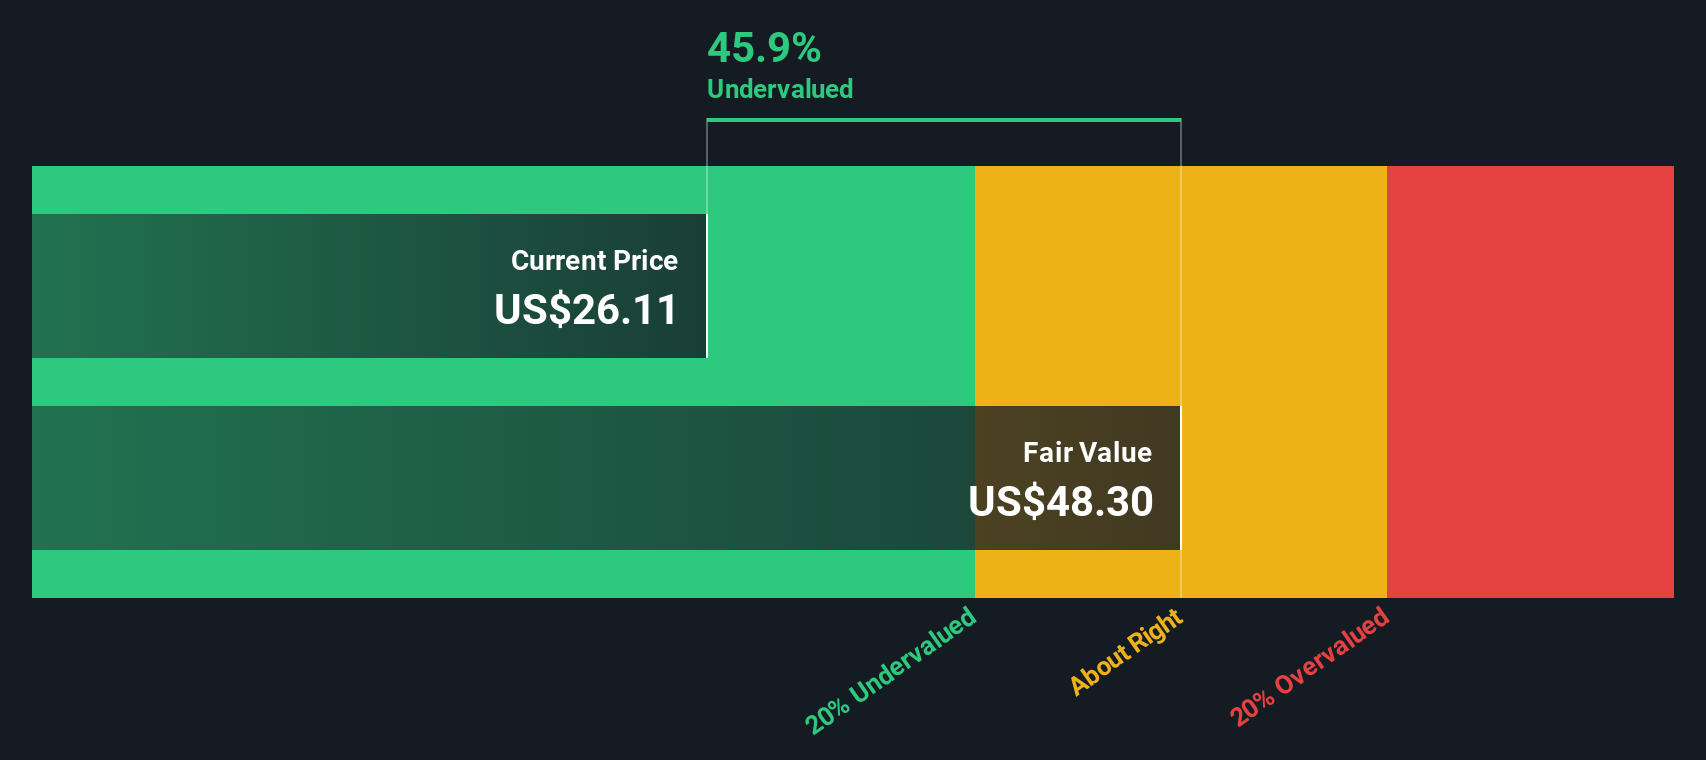
This model produces an estimated fair value of about $52.51 per share, compared with the recent share price of $32.05. That implies a DCF based discount of roughly 39.0%, which indicates that the shares appear undervalued on this specific cash flow framework.
Result: UNDERVALUED
Our Discounted Cash Flow (DCF) analysis suggests Archrock is undervalued by 39.0%. Track this in your watchlist or portfolio, or discover 53 more high quality undervalued stocks.
Approach 2: Archrock Price vs Earnings
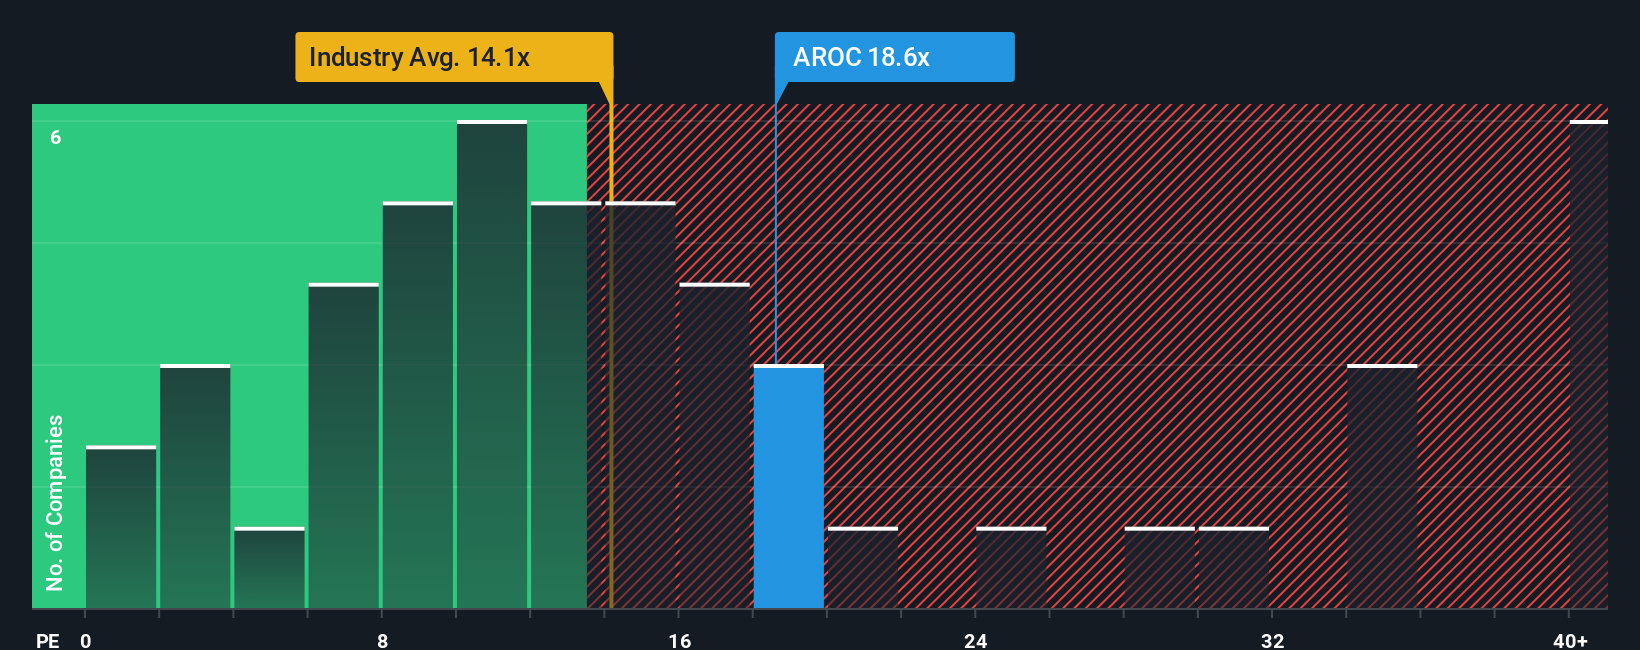
For a profitable company like Archrock, the P/E ratio is a useful way to think about what you are paying for each dollar of current earnings. Investors usually accept a higher or lower P/E based on what they expect for future growth and how much risk they see in those earnings.
Archrock currently trades on a P/E of 21.44x. That sits below the Energy Services industry average of 24.34x and well below the peer group average of 47.02x, which might initially suggest the shares are priced more conservatively than many competitors.
Simply Wall St’s Fair Ratio for Archrock is 18.79x. This is a proprietary estimate of what a “normal” P/E could look like for the company, given factors such as its earnings growth profile, industry, profit margins, market cap and risk characteristics. Because it is tailored to Archrock rather than based on broad group averages, the Fair Ratio can be a more targeted yardstick than simple industry or peer comparisons.
Comparing the Fair Ratio of 18.79x with the actual P/E of 21.44x suggests the shares screen as somewhat expensive on this metric.
Result: OVERVALUED
P/E ratios tell one story, but what if the real opportunity lies elsewhere? Start investing in legacies, not executives. Discover our 22 top founder-led companies.
Upgrade Your Decision Making: Choose your Archrock Narrative
Earlier we mentioned that there is an even better way to understand valuation. Let us introduce you to Narratives, which let you attach a clear story to your numbers by linking your view on Archrock’s future revenue, earnings and margins to a forecast and then to a fair value estimate.
On Simply Wall St’s Community page, Narratives are an easy tool you can use to set your own assumptions, see the resulting fair value, and then compare that fair value with the current share price to help you decide whether Archrock looks attractive, fully priced or expensive based on your thesis.
Because Narratives on the platform update automatically when new information such as earnings releases or news is added, your story, your forecast and your fair value can stay aligned with the latest data without you needing to rebuild everything from scratch.
For Archrock, one investor might create a Narrative that points to a higher fair value using more optimistic revenue and margin assumptions. Another might use more cautious inputs that lead to a lower fair value. Seeing both side by side can clarify which story you find more convincing before you act.
Do you think there's more to the story for Archrock? Head over to our Community to see what others are saying!
This article by Simply Wall St is general in nature. We provide commentary based on historical data and analyst forecasts only using an unbiased methodology and our articles are not intended to be financial advice. It does not constitute a recommendation to buy or sell any stock, and does not take account of your objectives, or your financial situation. We aim to bring you long-term focused analysis driven by fundamental data. Note that our analysis may not factor in the latest price-sensitive company announcements or qualitative material. Simply Wall St has no position in any stocks mentioned.