Is It Too Late To Consider AST SpaceMobile (ASTS) After Its 251% One Year Surge
AST SPACEMOBILE INC ASTS | 92.62 | +10.28% |
- If you are trying to figure out whether AST SpaceMobile is priced attractively or already baking in big expectations, you are in the right place for a clear look at its valuation.
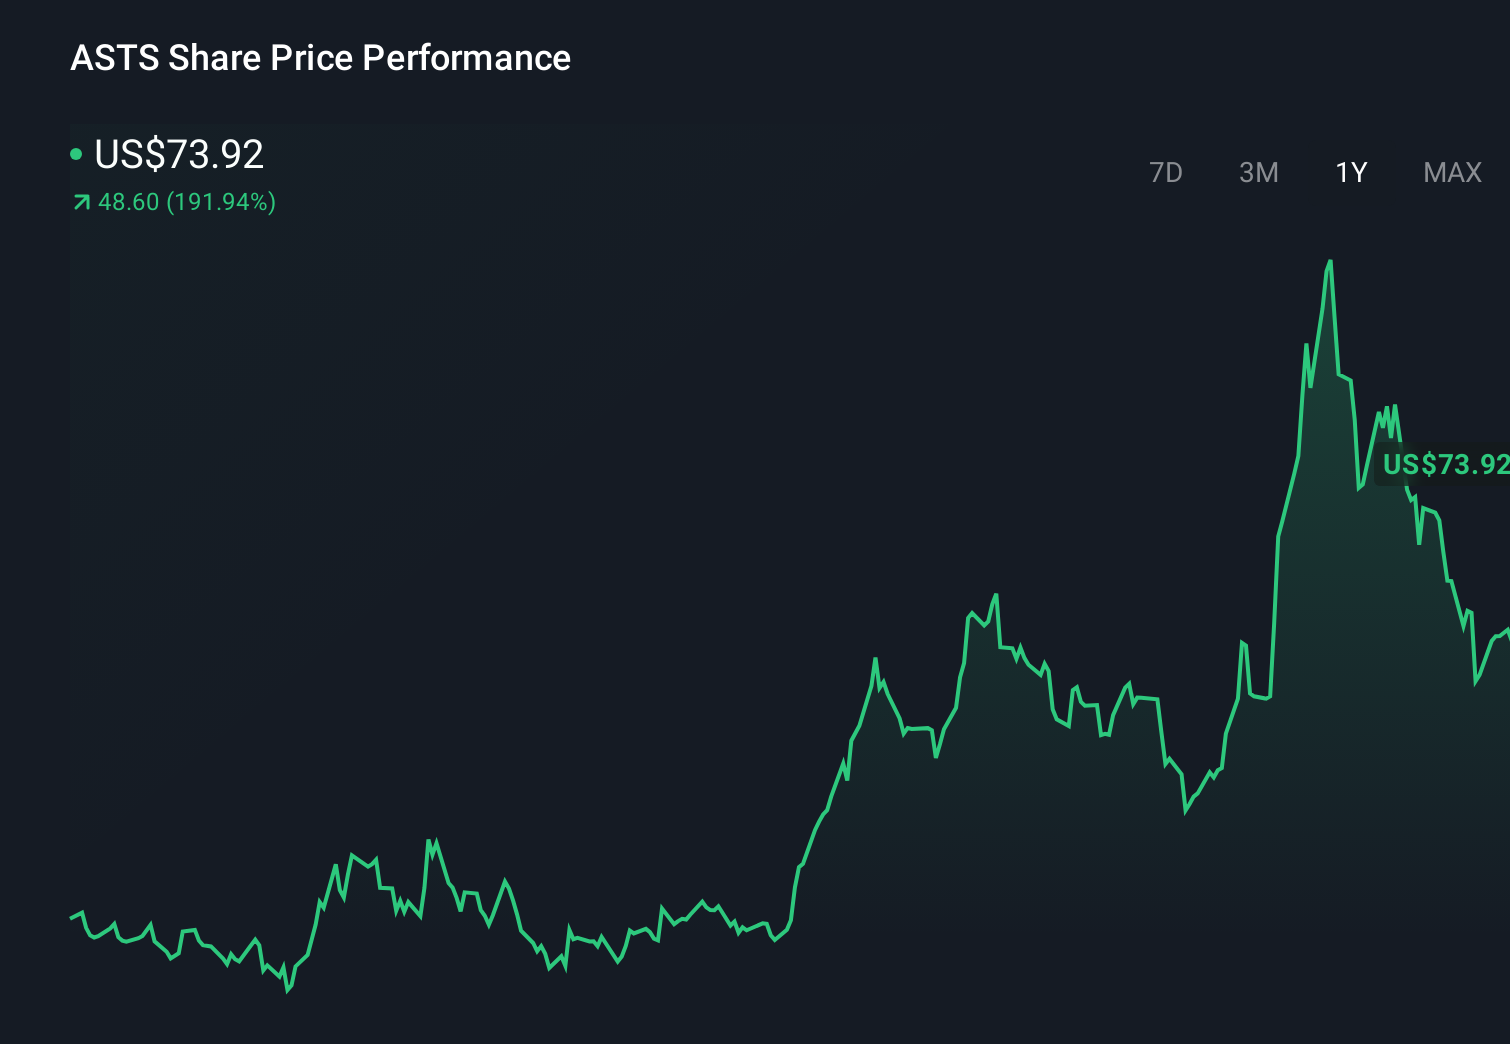
- The share price recently closed at US$96.92, with returns of 16.1% year to date and 251.0% over the last year, even after a 6.4% decline over the past week and a 1.5% decline over the last month.
- Recent news has focused on AST SpaceMobile's efforts to build a space based cellular broadband network, along with ongoing progress updates on its satellite technology and partnerships. These developments give important context for understanding why the stock has seen strong long term returns and shorter term pullbacks.
- Simply Wall St currently assigns AST SpaceMobile a valuation score of 1 out of 6, meaning it screens as undervalued on only one of six checks. Next we will look at how different valuation methods frame that score, before turning to a more complete way of thinking about value at the end of the article.
AST SpaceMobile scores just 1/6 on our valuation checks. See what other red flags we found in the full valuation breakdown.
Approach 1: AST SpaceMobile Discounted Cash Flow (DCF) Analysis
A Discounted Cash Flow, or DCF, model estimates what a company could be worth by projecting its future cash flows and then discounting those back to today in dollar terms. For AST SpaceMobile, Simply Wall St uses a 2 Stage Free Cash Flow to Equity model built on analyst forecasts and then extended projections.
The latest twelve month free cash flow is a loss of $1,078.07 million. Analyst inputs and extrapolated figures suggest free cash flow remaining negative in 2026 and 2027, then turning positive, reaching a projected $1,122.20 million in 2030. All cash flows are modelled in dollars, with the share price listed in US dollars, so there is no currency mismatch in this case.
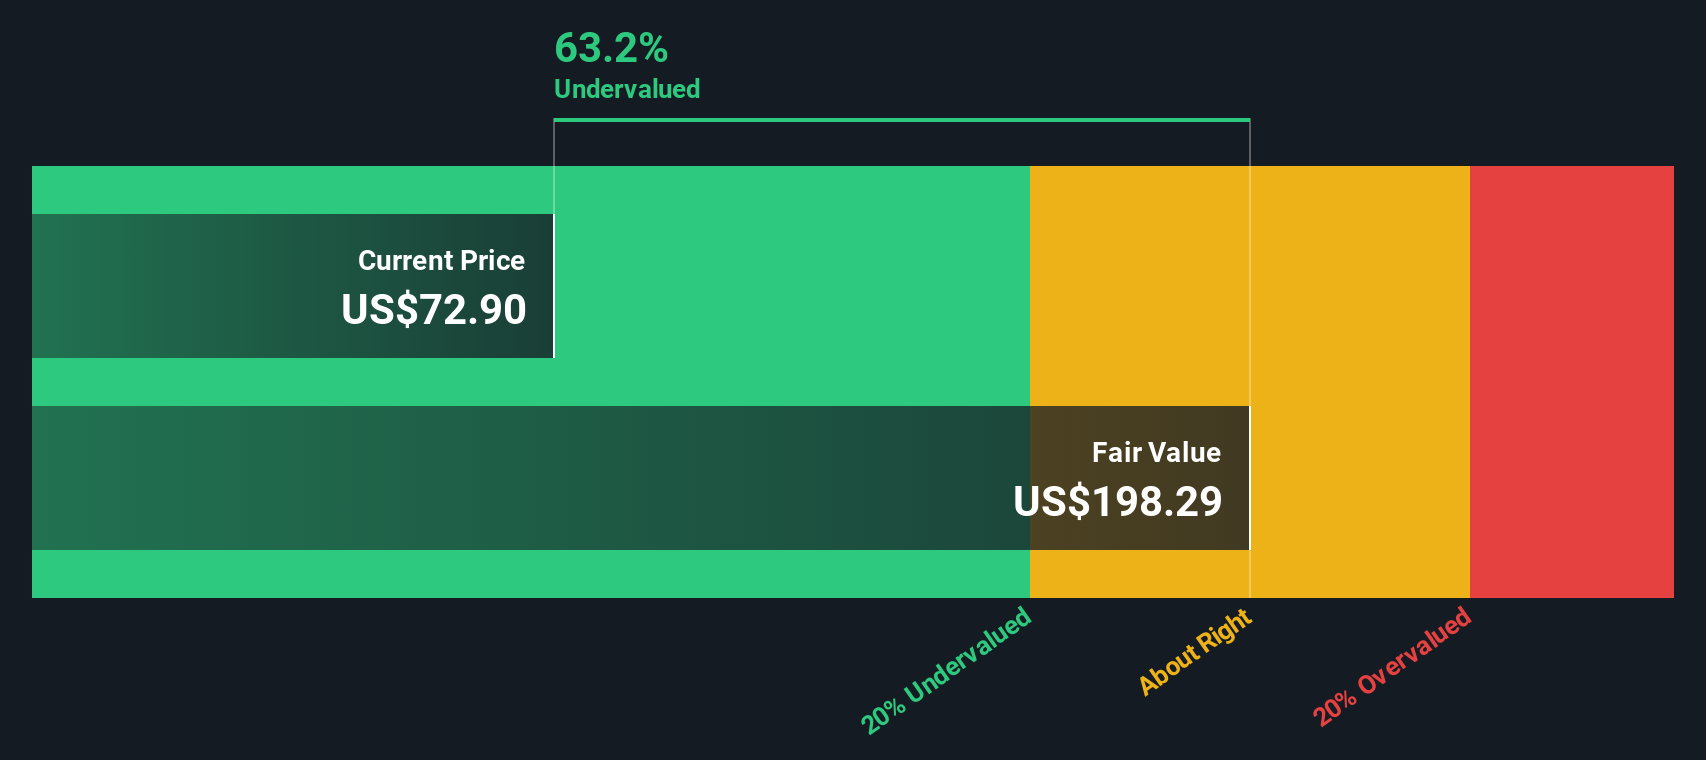
Pulling those ten year projections together, the model arrives at an estimated intrinsic value of US$105.84 per share, compared with the recent share price of US$96.92. That points to an implied discount of about 8.4%, which sits in the “close enough” zone rather than indicating that the shares are extremely cheap or clearly expensive.
Result: ABOUT RIGHT
AST SpaceMobile is fairly valued according to our Discounted Cash Flow (DCF), but this can change at a moment's notice. Track the value in your watchlist or portfolio and be alerted on when to act.
Approach 2: AST SpaceMobile Price vs Book Value
For companies where earnings are not yet a clear guide and free cash flow is still developing, the price to book, or P/B, ratio is often a useful way to think about what you are paying relative to the accounting value of net assets.
In broad terms, higher growth expectations and higher perceived risk tend to justify a higher P/B or P/E multiple, while slower expected growth and lower risk often support a lower, more conservative multiple. That is why looking at context matters more than the headline number on its own.
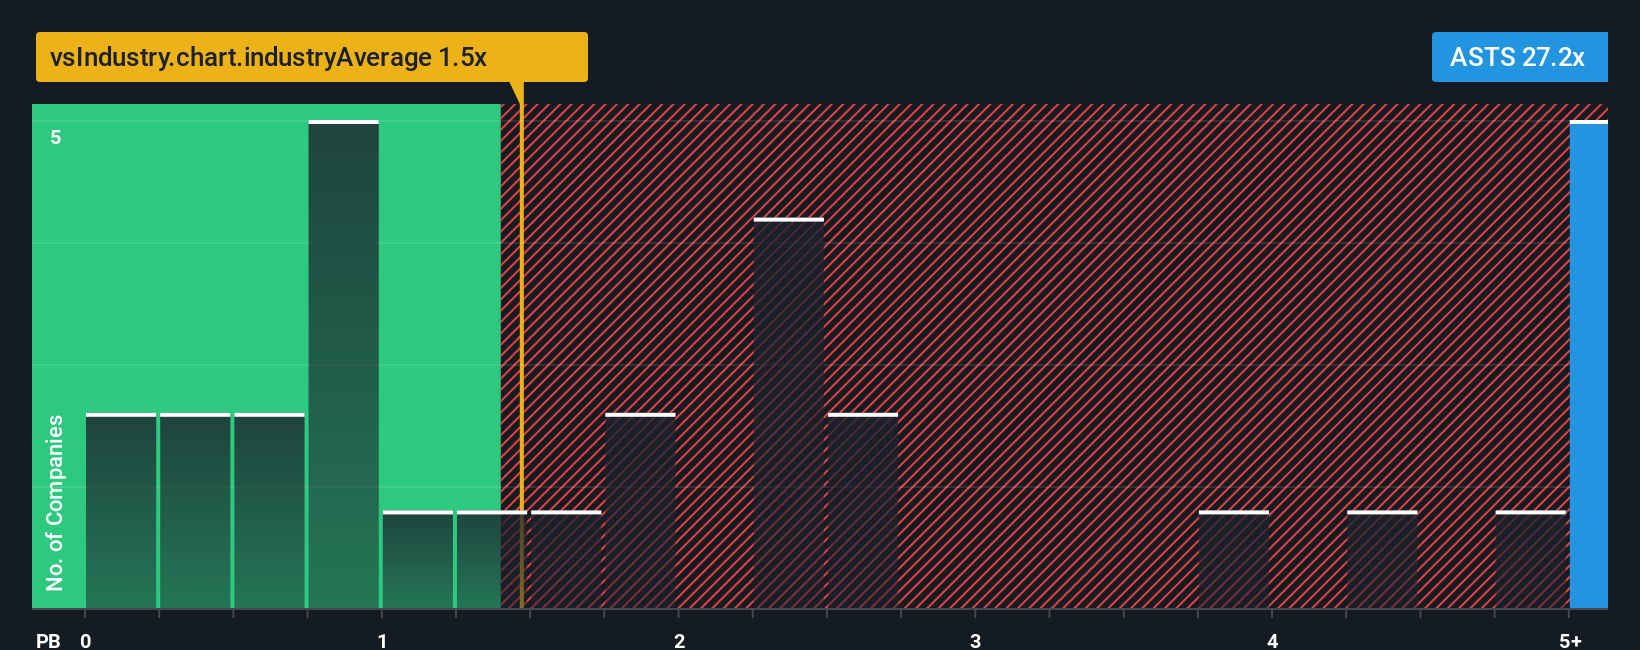
AST SpaceMobile currently trades on a P/B of 21.94x. This compares with a Telecom industry average P/B of 1.02x and a peer group average of 6.44x, so the market is assigning a much higher multiple than these reference points.
Simply Wall St also uses a proprietary “Fair Ratio” for P/B, which estimates what multiple could make sense after considering factors such as earnings growth profile, profit margins, industry, market capitalization and company specific risks. This can be more tailored than a simple comparison with sector averages or peers that may have very different growth and risk characteristics.
In this case, a Fair Ratio figure is not available. As a result, you are left weighing the current 21.94x P/B against those simpler benchmarks without that extra layer of adjustment.
Result: ABOUT RIGHT
P/B ratios tell one story, but what if the real opportunity lies elsewhere? Start investing in legacies, not executives. Discover our 22 top founder-led companies.
Upgrade Your Decision Making: Choose your AST SpaceMobile Narrative
Earlier we mentioned that there is an even better way to understand valuation. On Simply Wall St you can use Narratives on the Community page to write your own story for AST SpaceMobile, link that story to explicit forecasts for revenue, earnings and margins, and see a calculated fair value that you can compare to the current price. The Narrative then updates automatically as new news or earnings arrive.
For example, one AST SpaceMobile Narrative might lean cautious and anchor on a fair value of US$43.00. Another might take a more optimistic view at US$95.00. By seeing those side by side you can quickly decide which assumptions feel closest to your own and whether the current price looks high, low or roughly in line with what you think the business is worth.
Do you think there's more to the story for AST SpaceMobile? Head over to our Community to see what others are saying!
This article by Simply Wall St is general in nature. We provide commentary based on historical data and analyst forecasts only using an unbiased methodology and our articles are not intended to be financial advice. It does not constitute a recommendation to buy or sell any stock, and does not take account of your objectives, or your financial situation. We aim to bring you long-term focused analysis driven by fundamental data. Note that our analysis may not factor in the latest price-sensitive company announcements or qualitative material. Simply Wall St has no position in any stocks mentioned.