

Is It Too Late To Consider Baker Hughes (BKR) After Its 82% One Year Surge?
Baker Hughes BKR | 0.00 |
- This article examines whether Baker Hughes stock still offers value after a strong run, looking at what the current price might be implying and how that compares with different valuation checks.
- Baker Hughes last closed at US$66.73, with the stock showing a 1.9% gain over the past week, a 41.6% return year to date, and an 82.3% return over the past year, despite a 3.2% decline over the last month.
- Recent coverage has focused on Baker Hughes as one of the larger energy services companies in the US, with attention on how investors are treating established oilfield service and technology providers relative to the broader energy sector. There has also been ongoing commentary about how energy infrastructure and services stocks are being assessed against long term demand for energy and related equipment.
- Right now Baker Hughes scores 4 out of 6 on Simply Wall St's valuation checks, giving it a valuation score of 4. The sections that follow will explain what different valuation methods suggest about that score and will outline a more complete way to think about value at the end of the article.
Approach 1: Baker Hughes Discounted Cash Flow (DCF) Analysis
A Discounted Cash Flow, or DCF, model estimates what a stock might be worth by projecting future cash flows and discounting them back to today using a required return. It focuses on cash that could, in theory, be returned to shareholders over time.
For Baker Hughes, the model used is a 2 Stage Free Cash Flow to Equity approach based on cash flow projections. The latest twelve month free cash flow is about US$2.31b. Simply Wall St uses analyst estimates for the next few years and then extends those projections, with free cash flow for 2030 modeled at US$3.65b. That path is supported by a set of annual forecasts between 2026 and 2035, which are then discounted back to present value using the model's assumptions.
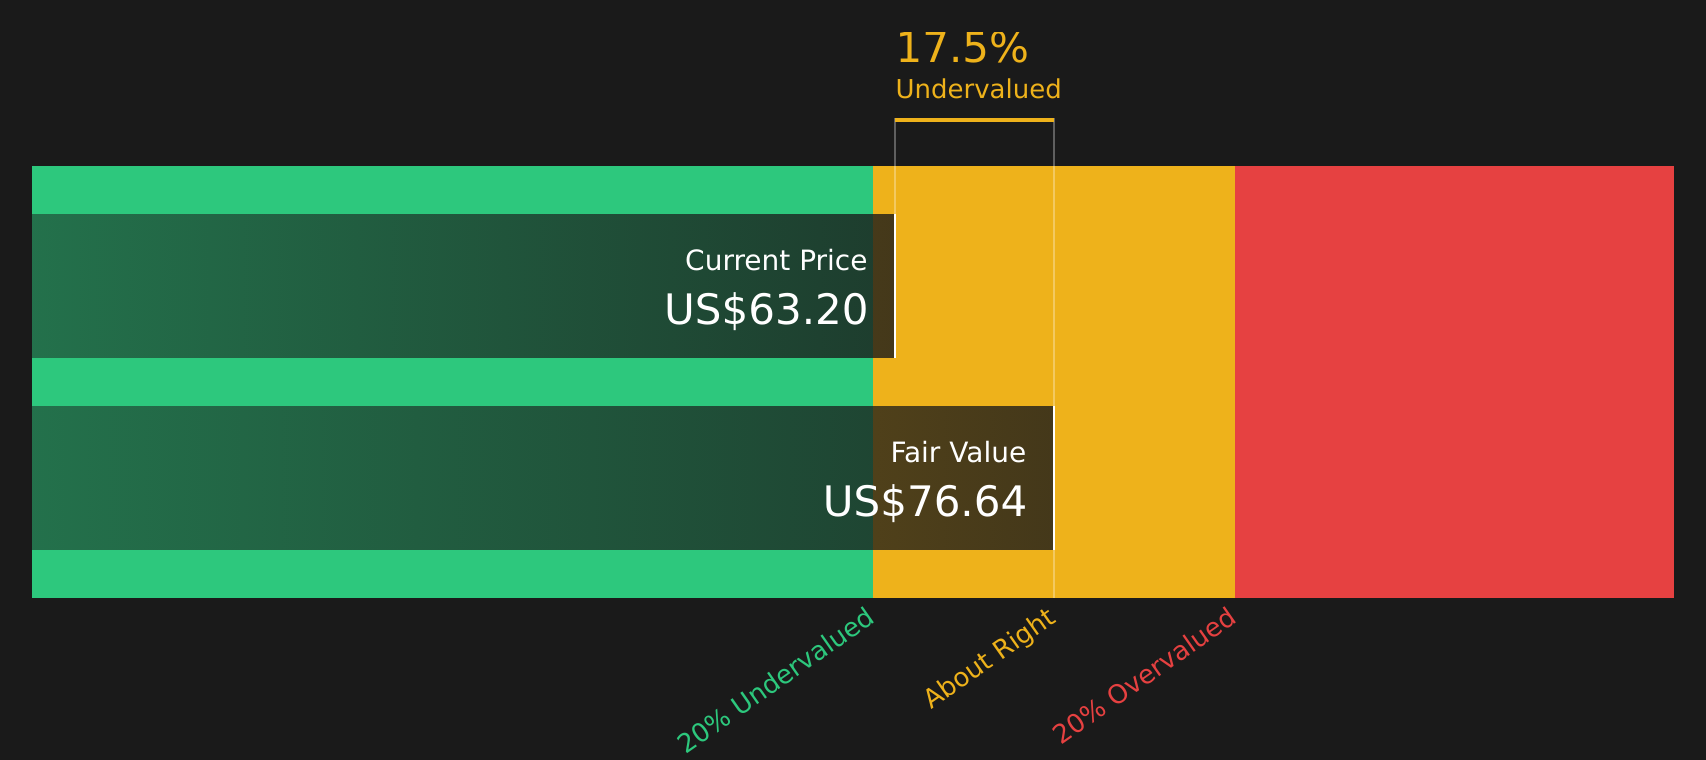
Pulling this together, the DCF model produces an estimated intrinsic value of US$76.56 per share. Compared with the recent share price of US$66.73, this implies the stock is about 12.8% undervalued based on these cash flow assumptions.
Result: UNDERVALUED
Our Discounted Cash Flow (DCF) analysis suggests Baker Hughes is undervalued by 12.8%. Track this in your watchlist or portfolio, or discover 46 more high quality undervalued stocks.
Approach 2: Baker Hughes Price vs Earnings
For a profitable company like Baker Hughes, the P/E ratio is a useful way to think about value because it ties the share price directly to the earnings that support it. In general, higher expected earnings growth and lower perceived risk can justify a higher P/E multiple, while lower growth expectations or higher risk tend to support a lower P/E.
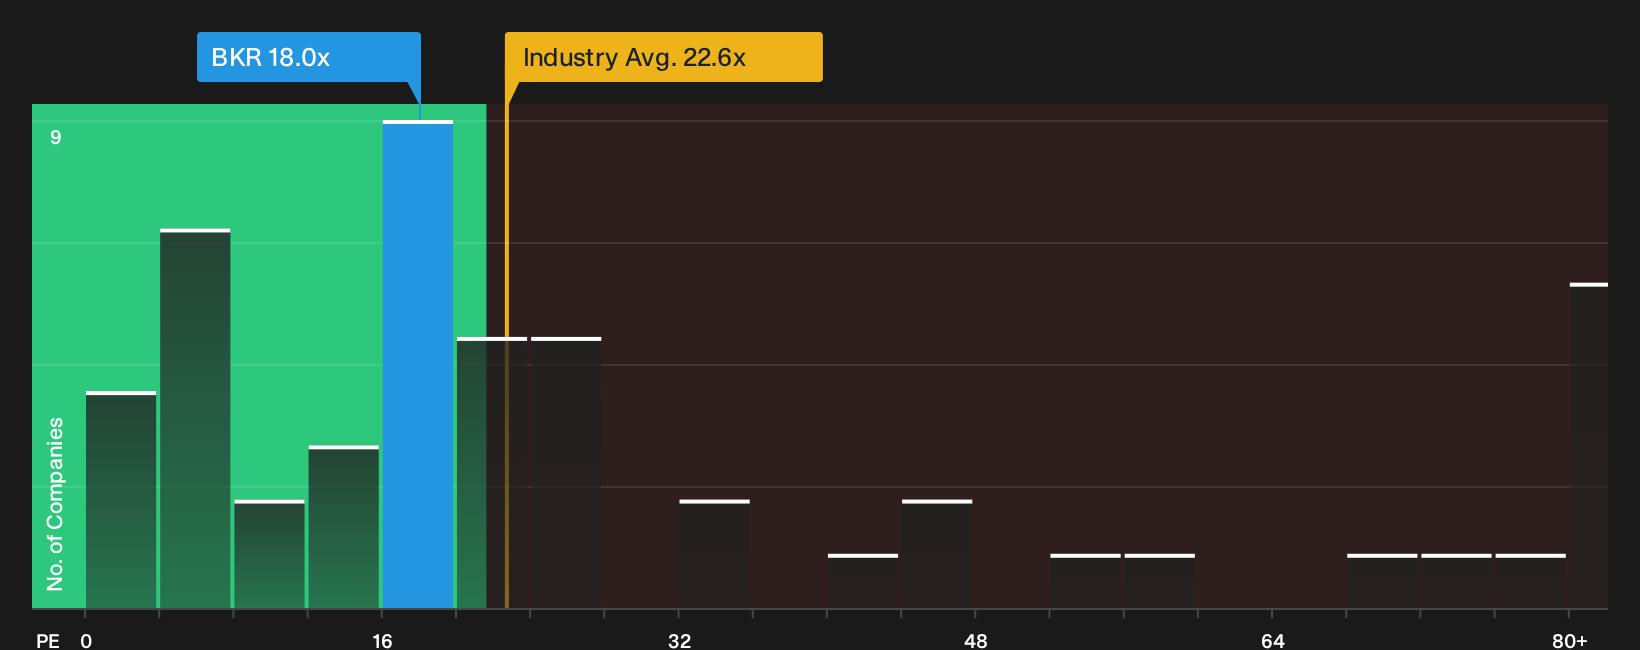
Baker Hughes currently trades on a P/E of 21.25x. That sits below the Energy Services industry average P/E of 26.68x and below the peer group average of 39.48x, so on simple comparisons the stock is priced at a lower multiple of earnings than many similar companies.
Simply Wall St also calculates a Fair Ratio for Baker Hughes of 23.44x. This is a proprietary estimate of what the P/E might be given factors such as the company’s earnings growth profile, industry, profit margins, market cap and risk characteristics. Because it blends these fundamentals, the Fair Ratio can provide a more tailored reference point than basic peer or industry averages. Comparing the Fair Ratio with the current P/E suggests Baker Hughes trades below this level, which points to the stock being undervalued on this metric.
Result: UNDERVALUED
P/E ratios tell one story, but what if the real opportunity lies elsewhere? Start investing in legacies, not executives. Discover our 20 top founder-led companies.
Upgrade Your Decision Making: Choose your Baker Hughes Narrative
Earlier it was mentioned that there is an even better way to understand valuation, so this is where Narratives come in, giving you a simple story that links your view on Baker Hughes to the numbers you plug in for future revenue, earnings, margins and fair value.
A Narrative on Simply Wall St is your own explanation for why Baker Hughes might justify a certain fair value, tying together what you think about LNG exposure, data center demand, data center power projects or portfolio reshaping with a concrete financial forecast.
Within the Community page, millions of investors use Narratives as an accessible tool that connects a company’s story to a set of assumptions, and then to a fair value estimate that can be compared directly with the current share price to help decide whether the stock looks expensive or cheap relative to that view.
Narratives are updated as new information arrives, such as Baker Hughes securing large data center power awards or progressing the Chart acquisition, so your fair value view does not stay static while the business changes around it.
For Baker Hughes, one investor might align with a more cautious Narrative that assumes revenue of US$29.2b, earnings of US$2.6b and a fair value near US$52.30. Another might back a more optimistic Narrative that assumes revenue of US$34.3b, earnings of US$3.6b and a fair value near US$80, with the current price around US$64.12 to US$68.94 providing a live reference point between those views.
For Baker Hughes however, we will make it really easy for you with previews of two leading Baker Hughes Narratives:
Each one gives you a clear story, a fair value anchor and the key assumptions you would be signing up for, so you can see which version of the future feels closer to your own view.
Fair value in this bullish Narrative: US$80.00 per share.
Implied undervaluation vs the last close of US$66.73: about 16.6%.
Revenue growth assumption: 7.09% per year.
- Backlog and orders across LNG, gas infrastructure, carbon management and power systems are used as support for multi year revenue visibility and earnings resilience.
- Data center power projects, digital solutions like Cordant and Leucipa and portfolio reshaping, including the pending Chart acquisition, are treated as levers for margin quality and free cash flow.
- The Narrative aligns with the more bullish analyst cohort, tying a US$80.00 fair value to earnings of US$3.6b by 2029 and a P/E of 27.4x, discounted at about 7.4%.
Fair value in this bearish Narrative: US$52.30 per share.
Implied overvaluation vs the last close of US$66.73: about 27.5%.
Revenue growth assumption: 1.50% per year.
- LNG and gas project concentration, stretched data center power capacity and reliance on current power systems spending are highlighted as sources of future revenue and margin pressure if activity cools.
- Execution risks around the Chart acquisition, divestitures and targeted cost synergies, together with dependence on higher upstream investment, are central to the more cautious earnings path.
- The Narrative aligns with the more bearish analyst cohort, tying a US$52.30 fair value to revenues of US$29.2b, earnings of US$2.6b and a P/E of 25.6x by 2029, discounted at about 7.7%.
Do you think there's more to the story for Baker Hughes? Head over to our Community to see what others are saying!

This article by Simply Wall St is general in nature. We provide commentary based on historical data and analyst forecasts only using an unbiased methodology and our articles are not intended to be financial advice. It does not constitute a recommendation to buy or sell any stock, and does not take account of your objectives, or your financial situation. We aim to bring you long-term focused analysis driven by fundamental data. Note that our analysis may not factor in the latest price-sensitive company announcements or qualitative material. Simply Wall St has no position in any stocks mentioned.