

Is It Too Late To Consider BlackRock (BLK) After Recent Asset Management Headlines?
BlackRock, Inc. BLK | 0.00 |
- If you are wondering whether BlackRock at around US$1,001.54 is priced for opportunity or already reflects the story, this breakdown is designed to help you make sense of that question.
- The stock has returned 4.6% over the last week and 4.6% over the last month, while the year-to-date return is a 7.7% decline and the 1-year return is 13.9%, set against a 3-year return of 61.4% and 5-year return of 40.9%.
- Recent headlines around BlackRock have focused on its role as a major global asset manager, including coverage of product launches, regulatory discussions and its involvement in broader market themes. Together, these stories help frame how investors are thinking about both its potential and the risks that might be getting priced in.
- BlackRock currently has a valuation score of 2 out of 6, so next you will see how different valuation methods stack up for the stock and then, at the end of the article, a broader way to think about what that valuation really means for you.
BlackRock scores just 2/6 on our valuation checks. See what other red flags we found in the full valuation breakdown.
Approach 1: BlackRock Excess Returns Analysis
The Excess Returns model evaluates how much value a company creates over and above the return that investors require on its equity. It starts from the book value per share and then assesses whether the earnings generated on that equity are high enough to justify a premium over that base.
For BlackRock, the model uses a Book Value of $360.41 per share and a Stable EPS of $55.87 per share, based on weighted future Return on Equity estimates from 6 analysts. The Average Return on Equity is 15.74%, which is compared with a Cost of Equity of $28.01 per share. The difference between what shareholders require and what the business is expected to earn is captured as an Excess Return of $27.86 per share.
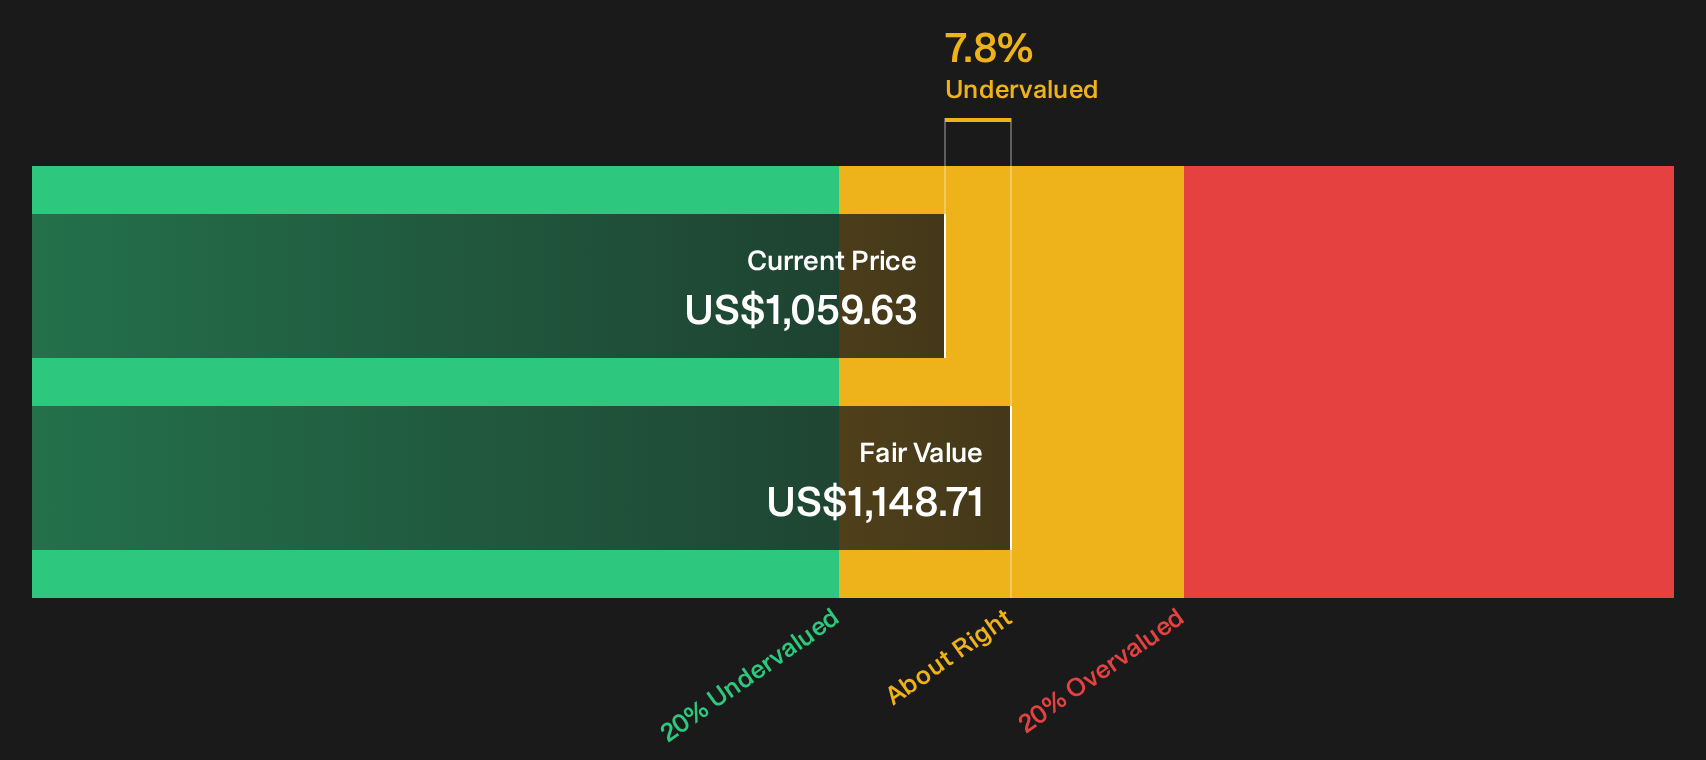
The analysis also incorporates a Stable Book Value of $354.93 per share, sourced from weighted future Book Value estimates from 4 analysts. Using these inputs, the Excess Returns model arrives at an intrinsic value of about $976.57 per share, which suggests that the current price around $1,001.54 is about 2.6% above that estimate.
Result: ABOUT RIGHT
BlackRock is fairly valued according to our Excess Returns, but this can change at a moment's notice. Track the value in your watchlist or portfolio and be alerted on when to act.
Approach 2: BlackRock Price vs Earnings
For a profitable company like BlackRock, the P/E ratio is a useful shorthand for what investors are currently willing to pay for each dollar of earnings. It connects directly to return expectations because it links the share price to the underlying profit stream.
What counts as a “fair” P/E depends on how quickly earnings are expected to grow and how risky those earnings are. Higher expected growth or lower perceived risk can justify a higher multiple, while slower growth or higher risk tend to support a lower one.
BlackRock currently trades on a P/E of 28.05x. This sits below the Capital Markets industry average P/E of about 39.09x, and above the peer group average of 24.02x. Simply Wall St’s Fair Ratio for BlackRock is 18.16x, which is its view of the P/E that might be expected given factors such as earnings growth, industry, profit margins, market cap and specific risks.
The Fair Ratio is more tailored than a simple peer or industry comparison because it adjusts for those company specific drivers instead of assuming that all firms in the group deserve similar multiples. Compared with the current 28.05x P/E, the Fair Ratio of 18.16x suggests the shares are trading at a richer level than this model implies.
Result: OVERVALUED

P/E ratios tell one story, but what if the real opportunity lies elsewhere? Start investing in legacies, not executives. Discover our 19 top founder-led companies.
Upgrade Your Decision Making: Choose your BlackRock Narrative
Earlier we mentioned that there is an even better way to understand valuation. Narratives are Simply Wall St’s way for you to attach a clear story about BlackRock to your numbers, by linking your view on its future revenue, earnings and margins to a financial forecast, a fair value, and then comparing that to today’s price to decide whether you think it is closer to opportunity or risk.
On the Community page, Narratives are set up as an accessible tool that many investors already use. You can see and create different stories for the same company, each one tied to its own fair value estimate that updates when new information, such as earnings, news or guidance, comes through and feeds into those forecasts.
For example, one BlackRock Narrative on Simply Wall St currently anchors on a fair value of about US$1,160 per share, while another, more optimistic view uses a fair value of about US$1,392. By comparing those Narrative fair values to the current price, you can quickly see how different perspectives lead to different decisions about whether to be patient, add exposure, or wait for a wider margin of safety.
Do you think there's more to the story for BlackRock? Head over to our Community to see what others are saying!

This article by Simply Wall St is general in nature. We provide commentary based on historical data and analyst forecasts only using an unbiased methodology and our articles are not intended to be financial advice. It does not constitute a recommendation to buy or sell any stock, and does not take account of your objectives, or your financial situation. We aim to bring you long-term focused analysis driven by fundamental data. Note that our analysis may not factor in the latest price-sensitive company announcements or qualitative material. Simply Wall St has no position in any stocks mentioned.