Is It Too Late To Consider Blue Bird (BLBD) After Its 85% One Year Surge?
Blue Bird Corporation BLBD | 0.00 |
- Some investors may be wondering whether Blue Bird's share price still offers value after a strong run, or if most of the opportunity has already been priced in.
- The stock last closed at US$72.43, with returns of 2.2% over 7 days, 15.2% over 30 days, 54.9% year to date and 85.6% over the past year.
- Recent coverage has focused on how this long term share price performance has sharpened the market's focus on what Blue Bird might be worth compared with its current price. Investors are watching how sentiment around the stock aligns with its financial profile and long term prospects.
- On Simply Wall St's 6 point valuation framework, Blue Bird currently scores 5 out of 6. This invites a closer look at different valuation approaches and an even deeper way of thinking about value that will be covered at the end of this article.
Approach 1: Blue Bird Discounted Cash Flow (DCF) Analysis
A Discounted Cash Flow, or DCF, model estimates what a stock could be worth by projecting the cash the business may generate in the future and then discounting those cash flows back to today.
For Blue Bird, the model used is a 2 Stage Free Cash Flow to Equity approach. The company’s latest twelve month free cash flow is reported at $185.97 million. Based on analyst inputs for the next few years, and then extended projections by Simply Wall St out to 2035, free cash flow is projected at $221.16 million in ten years, in 2035.
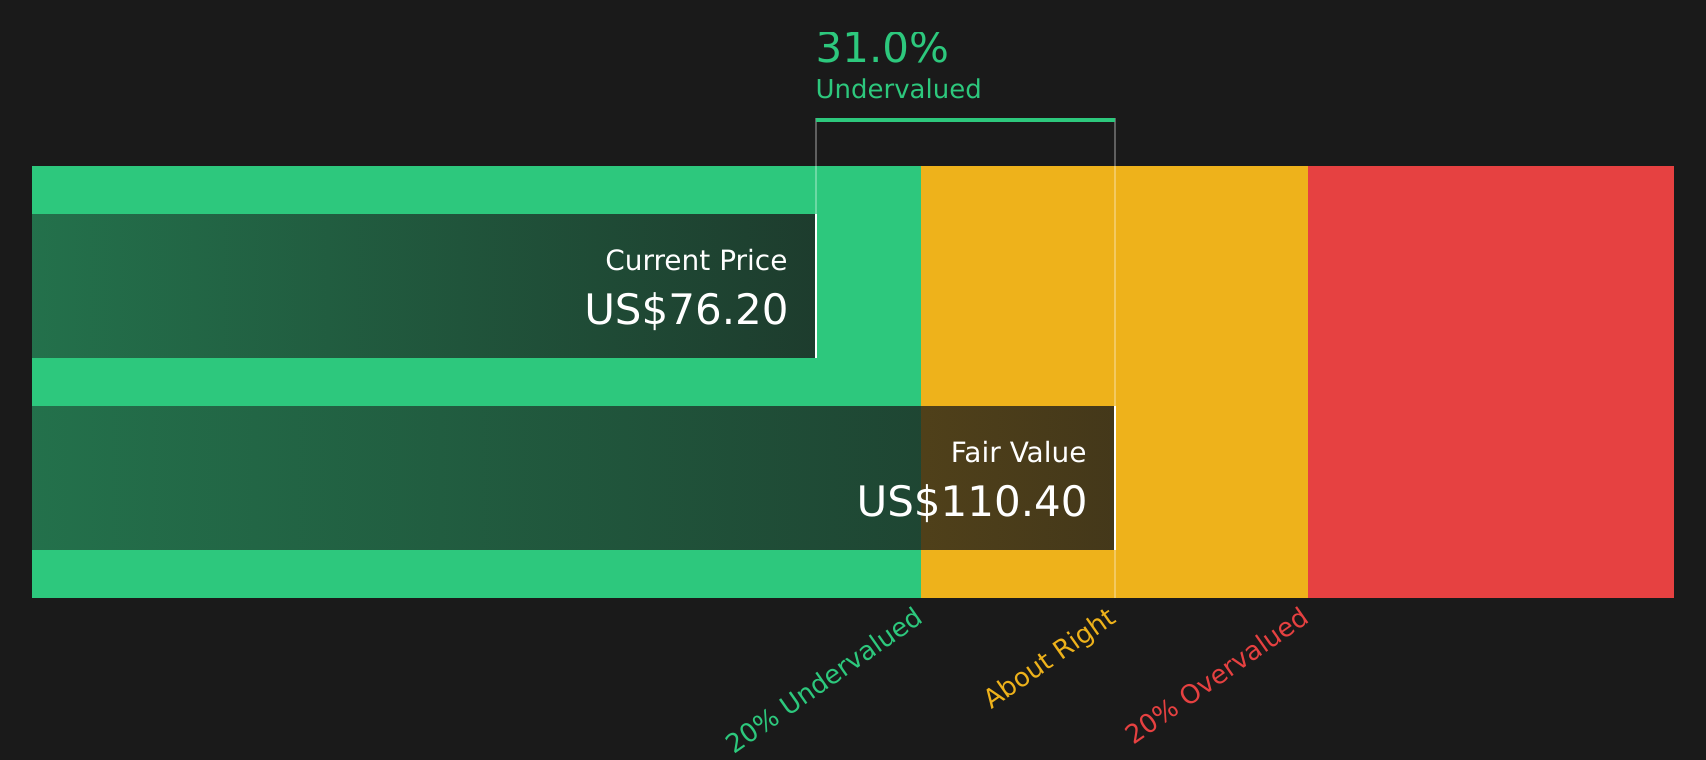
When all those projected cash flows are discounted back to today, the DCF model suggests an intrinsic value of about $100.50 per share. Compared with the recent share price of $72.43, this implies the stock is trading at a 27.9% discount to that estimate. On this framework, Blue Bird appears undervalued.
Result: UNDERVALUED
Our Discounted Cash Flow (DCF) analysis suggests Blue Bird is undervalued by 27.9%. Track this in your watchlist or portfolio, or discover 47 more high quality undervalued stocks.
Approach 2: Blue Bird Price vs Earnings
For profitable companies, the P/E ratio is a common way to think about value because it links what you pay for the stock to the earnings the business is currently generating. Investors typically accept higher P/E ratios when they expect stronger growth and lower risk, and look for lower P/E ratios when growth expectations are modest or risks are higher.
Blue Bird currently trades on a P/E of 17.2x. This sits below the Machinery industry average P/E of 27.2x and also below the peer group average of 25.2x. On the surface, that gap can suggest the stock is pricing in different growth or risk expectations compared with its industry and peers.
Simply Wall St’s Fair Ratio for Blue Bird is 25.3x. This is a proprietary estimate of what the P/E might be given factors such as the company’s earnings growth profile, profit margins, industry, market cap and assessed risks. Because it adjusts for these company specific drivers, the Fair Ratio can be more informative than a simple comparison with industry or peer averages. With the current P/E of 17.2x sitting below the Fair Ratio of 25.3x, the stock screens as undervalued on this multiple based approach.
Result: UNDERVALUED

Wall Street's queuing for one rocket. While SpaceX counts down to its IPO, other companies tied to the new space race are already in orbit. → 20 Compelling Space Companies watchlist · Global Space Race Investing Ideas screener · Scan the sector by valuation on Rocket Lab's valuation page.
Upgrade Your Decision Making: Choose your Blue Bird Narrative
Earlier we mentioned that there is an even better way to understand valuation. Narratives let you attach a clear story about Blue Bird or any other stock to your numbers by connecting your view on future revenue, earnings and margins to a fair value estimate, then comparing that fair value with the current share price to help you decide if, when and how much you might want to buy or sell.
On Simply Wall St's Community page, Narratives are presented as an easy, accessible tool used by millions of investors. They update automatically when new information such as earnings releases or major news arrives so your story and your numbers stay aligned without constant manual rework.
For example, one Blue Bird Narrative might lean closer to the higher analyst fair value case of US$78.00, built around stronger margin and growth assumptions. Another might sit nearer the more cautious US$55.00 view, reflecting greater concern about policy support, funding and execution risks. Seeing these side by side helps you quickly decide which story, and therefore which fair value, best matches your own expectations before you act on the current price.
For Blue Bird, however, we will make it really easy for you with previews of two leading Blue Bird Narratives:
Fair value in this bullish narrative: US$78.00 per share.
Discount to this fair value versus the last close of US$72.43: about 7.1%.
Revenue growth assumption used in this narrative model: about 4.4% a year.
- Backlog, replacement demand and electrification are treated as long-running supports for revenue, helping the stock case for higher margins and buybacks.
- Automation, digitization and plant expansion are expected to improve unit economics and lift profitability compared with recent levels.
- Risks centre on school funding, demographics, remote learning and tech disruption, which could pressure volumes, pricing and returns if they turn out weaker than assumed.
Fair value in this more cautious narrative: about US$69.29 per share.
Premium to this fair value versus the last close of US$72.43: about 4.5%.
Revenue growth assumption used in this narrative model: about 3.6% a year.
- Government incentives for cleaner buses, fleet renewal and a large installed base support the case for steadier earnings and higher margins over time.
- Higher margin EV and alternative fuel buses, plus parts and service, are central to the earnings profile in this narrative.
- Key watchpoints are policy changes, funding constraints, tariffs and demographic trends, which could challenge the margin and growth assumptions that underpin the fair value.
If you want to go beyond the previews and see how other investors are framing the opportunity and risks, you can review the full set of community views in one place with the See what the community is saying about Blue Bird.
Do you think there's more to the story for Blue Bird? Head over to our Community to see what others are saying!

This article by Simply Wall St is general in nature. We provide commentary based on historical data and analyst forecasts only using an unbiased methodology and our articles are not intended to be financial advice. It does not constitute a recommendation to buy or sell any stock, and does not take account of your objectives, or your financial situation. We aim to bring you long-term focused analysis driven by fundamental data. Note that our analysis may not factor in the latest price-sensitive company announcements or qualitative material. Simply Wall St has no position in any stocks mentioned.