Is It Too Late To Consider BrightSpring Health Services (BTSG) After Its 79% One Year Rally?
BrightSpring Health Services, Inc. BTSG | 46.04 46.14 | +0.02% +0.21% Post |
- If you are wondering whether BrightSpring Health Services is still attractively priced after its run, this article will walk through what the current numbers are actually saying about the stock.
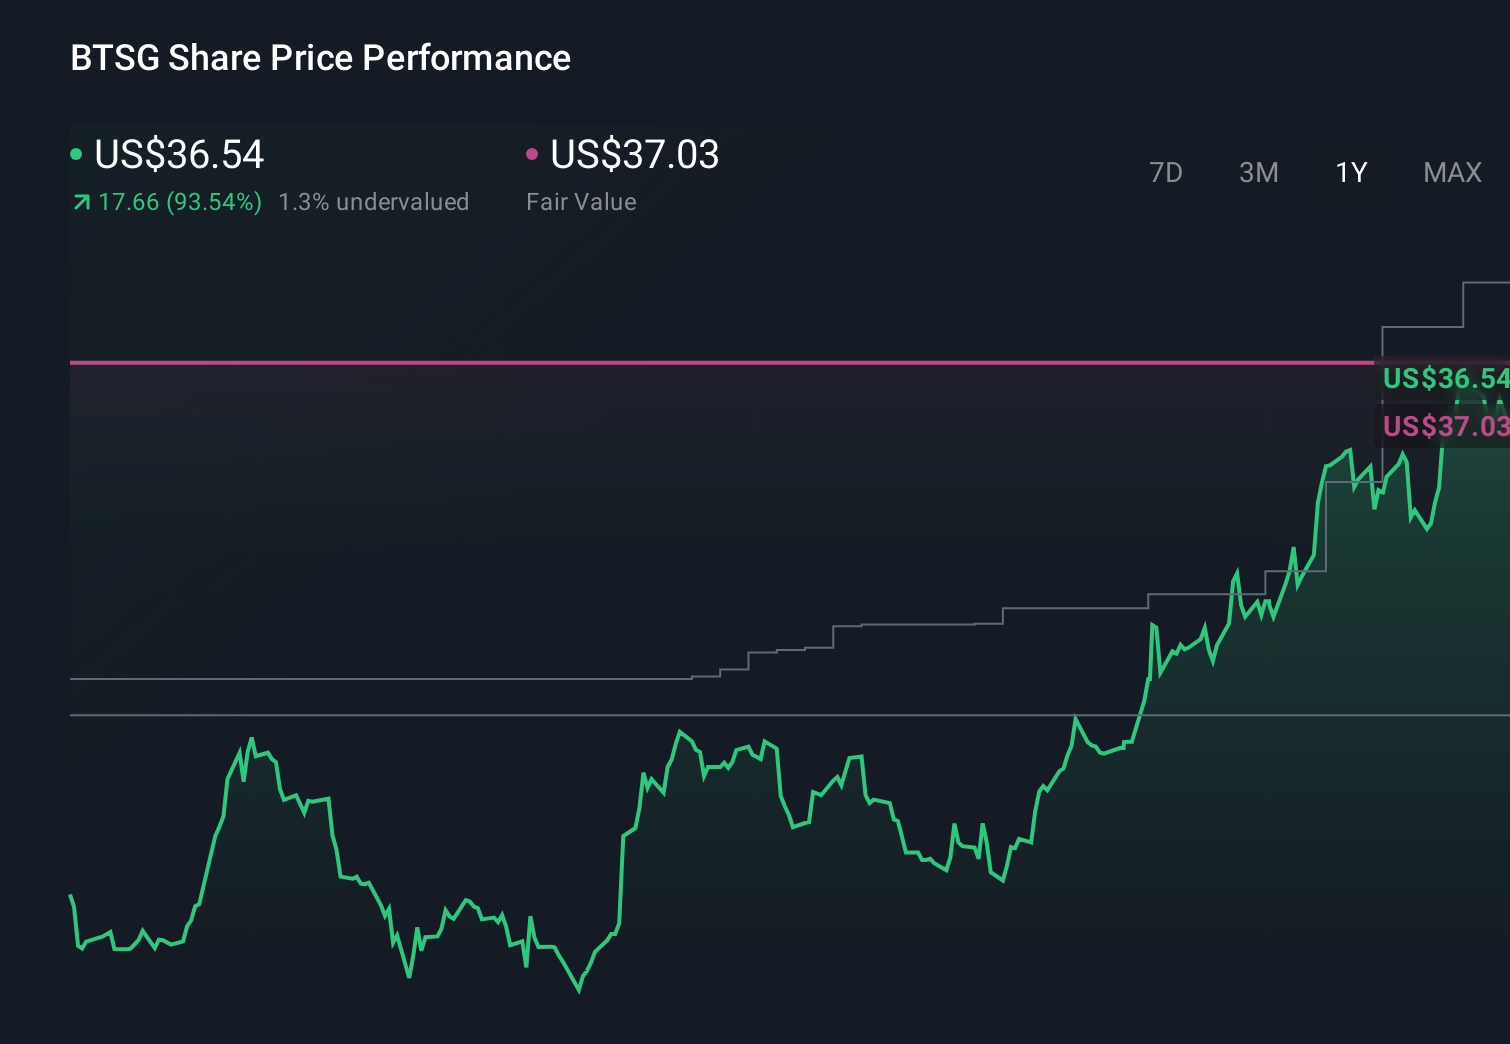
- The share price recently closed at US$39.68, with returns of 1.0% over the last 7 days, 5.7% over the last 30 days, 3.3% year to date and 79.5% over the last year, which has raised questions about how much value might already be reflected.
- Recent coverage of BrightSpring has focused on its role as a health services provider and ongoing interest from investors who are tracking the stock after this period of strong 1 year returns. This context has kept attention on whether the current share price aligns with what the fundamentals suggest the company could be worth.
- On our simple 6 point valuation checklist, BrightSpring scores 2 out of 6, which means some metrics flag potential undervaluation while others do not. Next we compare different valuation methods, then finish with a broader framework that can help you interpret those numbers more clearly.
BrightSpring Health Services scores just 2/6 on our valuation checks. See what other red flags we found in the full valuation breakdown.
Approach 1: BrightSpring Health Services Discounted Cash Flow (DCF) Analysis
A Discounted Cash Flow, or DCF, model estimates what a company could be worth today by projecting its future cash flows and then discounting those back to a single present value figure.
For BrightSpring Health Services, the model used is a 2 Stage Free Cash Flow to Equity approach. The latest twelve month free cash flow is about $251.8 million. Analysts have provided explicit forecasts out to 2030, with free cash flow projections such as $317.6 million in 2026 and $935.8 million in 2030, all in $. Beyond those analyst inputs, Simply Wall St extrapolates additional years of cash flows to complete the 10 year path.
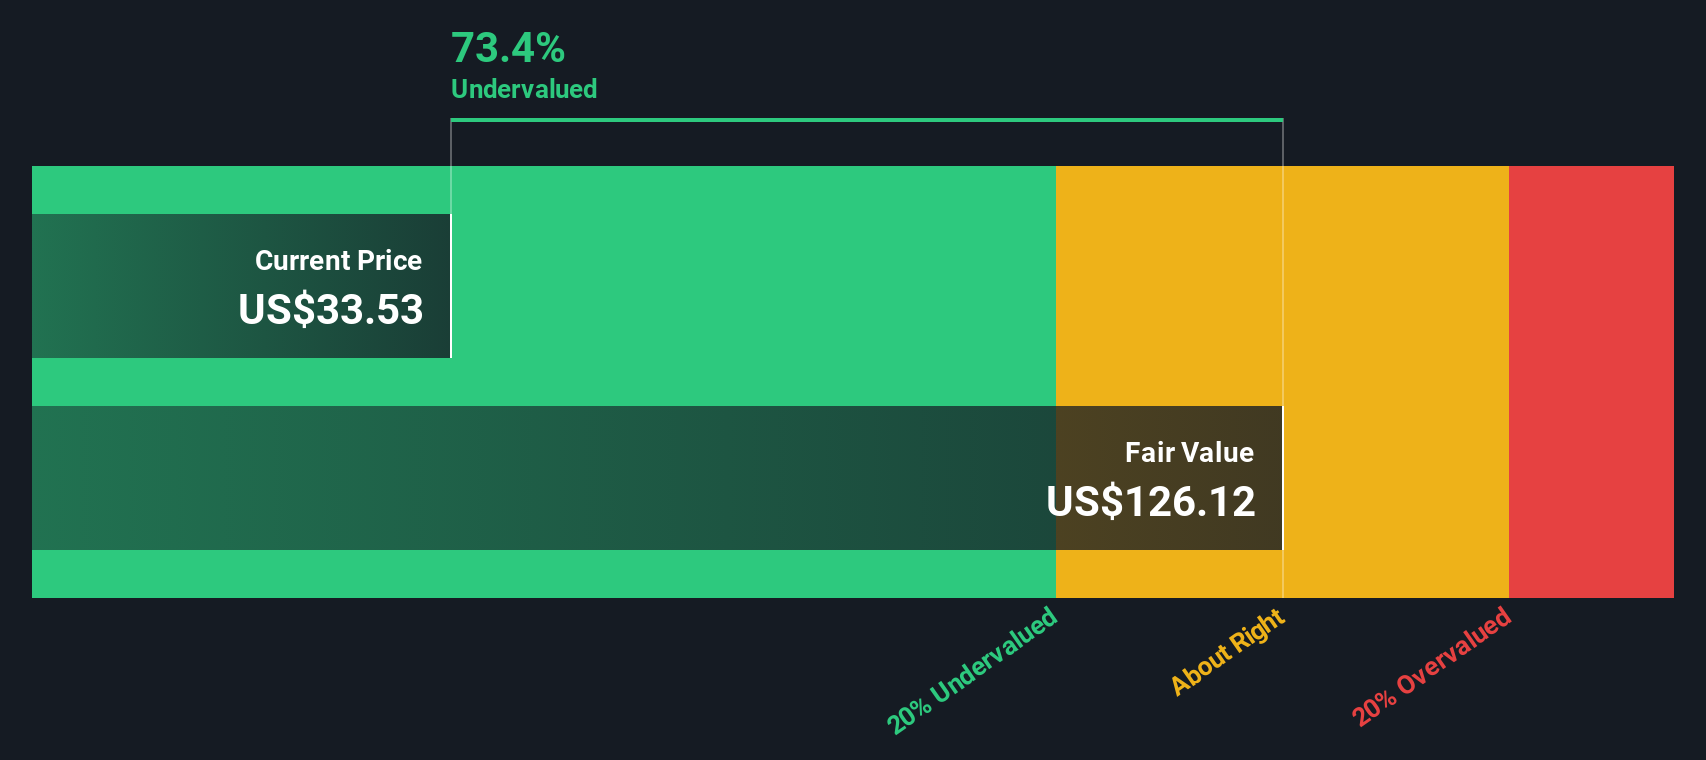
When all of these projected cash flows are discounted to today, the DCF model arrives at an estimated intrinsic value of about $144.23 per share. Compared with the recent share price of $39.68, this model estimates the stock is 72.5% undervalued.
Result: UNDERVALUED
Our Discounted Cash Flow (DCF) analysis suggests BrightSpring Health Services is undervalued by 72.5%. Track this in your watchlist or portfolio, or discover 52 more high quality undervalued stocks.
Approach 2: BrightSpring Health Services Price vs Earnings
For a profitable company, the P/E ratio is a useful way to see how much you are paying for each dollar of earnings, which most investors track closely when they think about what a stock might be worth.
What counts as a normal or fair P/E usually reflects two big forces: how the market views the company’s growth potential, and how risky those earnings appear to be. Higher expected growth or lower perceived risk will often justify a higher P/E, while slower expected growth or higher risk tends to support a lower P/E.
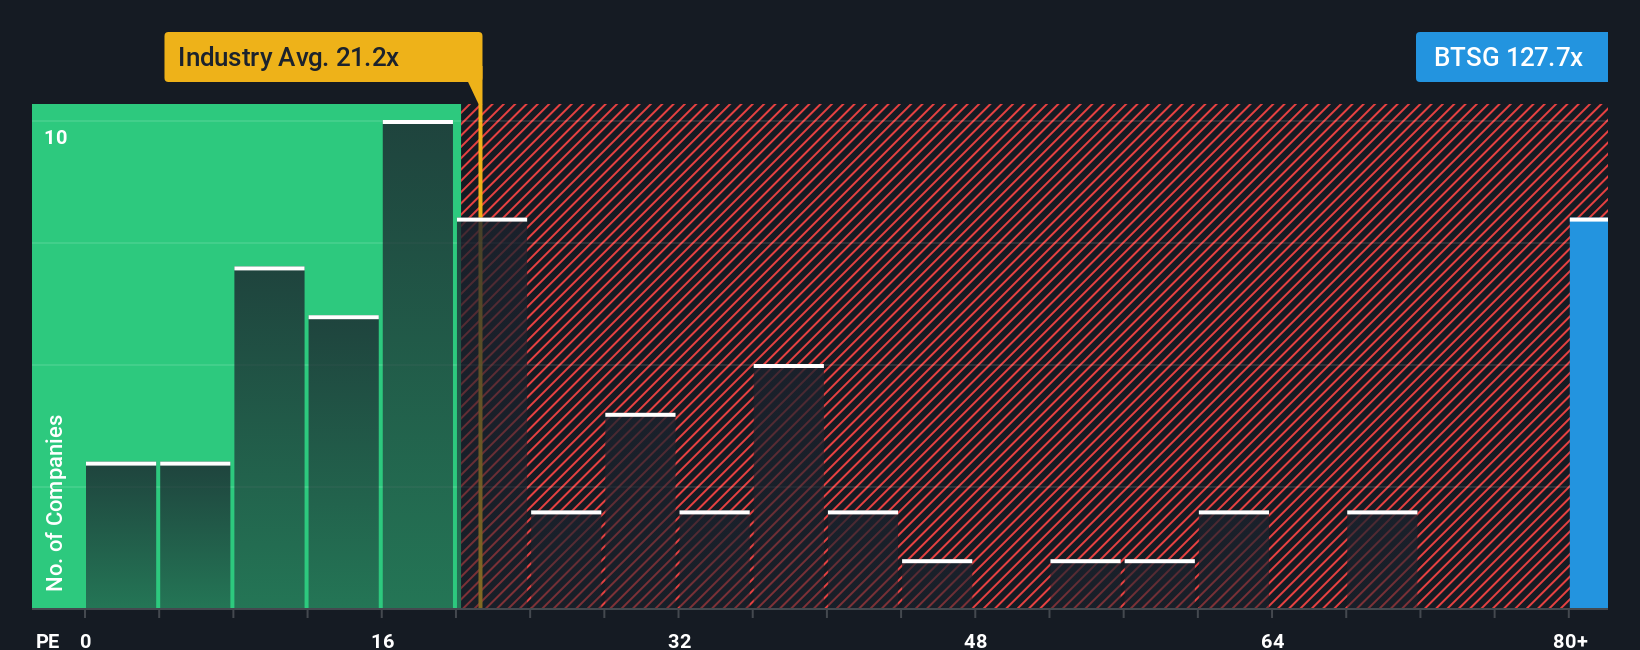
BrightSpring Health Services currently trades on a P/E of 74.28x. That sits well above the Healthcare industry average of 23.55x and the peer average of 25.25x. Simply Wall St’s Fair Ratio for BrightSpring is 32.01x, which is its proprietary estimate of what a reasonable P/E might be after accounting for factors such as earnings growth characteristics, industry, profit margins, market cap and specific risks.
This Fair Ratio can be more informative than a simple peer or industry comparison because it attempts to adjust for those company-specific factors rather than using a one-size-fits-all benchmark. Since BrightSpring’s actual P/E of 74.28x is materially higher than the Fair Ratio of 32.01x, the multiple-based view points to the shares looking expensive on current earnings.
Result: OVERVALUED
P/E ratios tell one story, but what if the real opportunity lies elsewhere? Start investing in legacies, not executives. Discover our 22 top founder-led companies.
Upgrade Your Decision Making: Choose your BrightSpring Health Services Narrative
Earlier we mentioned that there is an even better way to understand valuation, so let us introduce you to Narratives, which are simply your story about a company tied directly to your assumptions for fair value, future revenue, earnings and margins.
Instead of looking at the DCF or P/E in isolation, a Narrative connects how you see BrightSpring Health Services as a business to a financial forecast, then links that forecast to a fair value per share that you can compare with the current price.
On Simply Wall St, Narratives sit inside the Community page and are designed to be easy to use, so you can adjust assumptions, see how that changes fair value, and use that comparison between Fair Value and Price to help decide whether a stock looks attractive to you or not.
Narratives also refresh when new information like earnings reports or major news is added, and for BrightSpring you might see one investor using very optimistic revenue and margin assumptions that support a much higher fair value while another uses more cautious assumptions that result in a much lower fair value, showing how different stories can lead to very different conclusions.
Do you think there's more to the story for BrightSpring Health Services? Head over to our Community to see what others are saying!
This article by Simply Wall St is general in nature. We provide commentary based on historical data and analyst forecasts only using an unbiased methodology and our articles are not intended to be financial advice. It does not constitute a recommendation to buy or sell any stock, and does not take account of your objectives, or your financial situation. We aim to bring you long-term focused analysis driven by fundamental data. Note that our analysis may not factor in the latest price-sensitive company announcements or qualitative material. Simply Wall St has no position in any stocks mentioned.