Is It Too Late To Consider Buying Fortinet (FTNT) After Its Recent Surge In Price
Fortinet, Inc. FTNT | 0.00 |
- If you are considering Fortinet at around US$127.64 and wondering whether it still offers value or if you may be arriving late, this article walks through what the current price could mean for you.
- The stock has seen sharp recent moves, with returns of 12.1% over 7 days, 56.0% over 30 days, 63.9% year to date, 21.8% over 1 year, 87.5% over 3 years, and 197.4% over 5 years.
- Recent coverage of Fortinet has focused on its role in cybersecurity and how investors are reassessing large, established security platforms compared with smaller peers. This context helps frame these strong recent returns. Headlines have also highlighted ongoing interest in stocks tied to digital security, keeping attention on how much investors are currently willing to pay for that exposure.
- Simply Wall St currently assigns Fortinet a valuation score of 1/6. The next step is to break down what different valuation methods say about that price and then look at a more complete way to think about value that will be covered at the end of the article.
Fortinet scores just 1/6 on our valuation checks. See what other red flags we found in the full valuation breakdown.
Approach 1: Fortinet Discounted Cash Flow (DCF) Analysis
A Discounted Cash Flow, or DCF, model takes estimates of the cash a company could generate in the future and discounts those back to today, aiming to translate all those projected dollars into a single present value per share.
For Fortinet, the latest twelve month Free Cash Flow is about $2.43b. Analysts and extrapolated estimates point to Free Cash Flow of $2.70b in 2026 and $4.55b in 2030, with intermediate years and later forecasts supplied by a 2 Stage Free Cash Flow to Equity model. Simply Wall St converts those ten year projections into today’s dollars, using a discount rate to reflect risk and the time value of money.
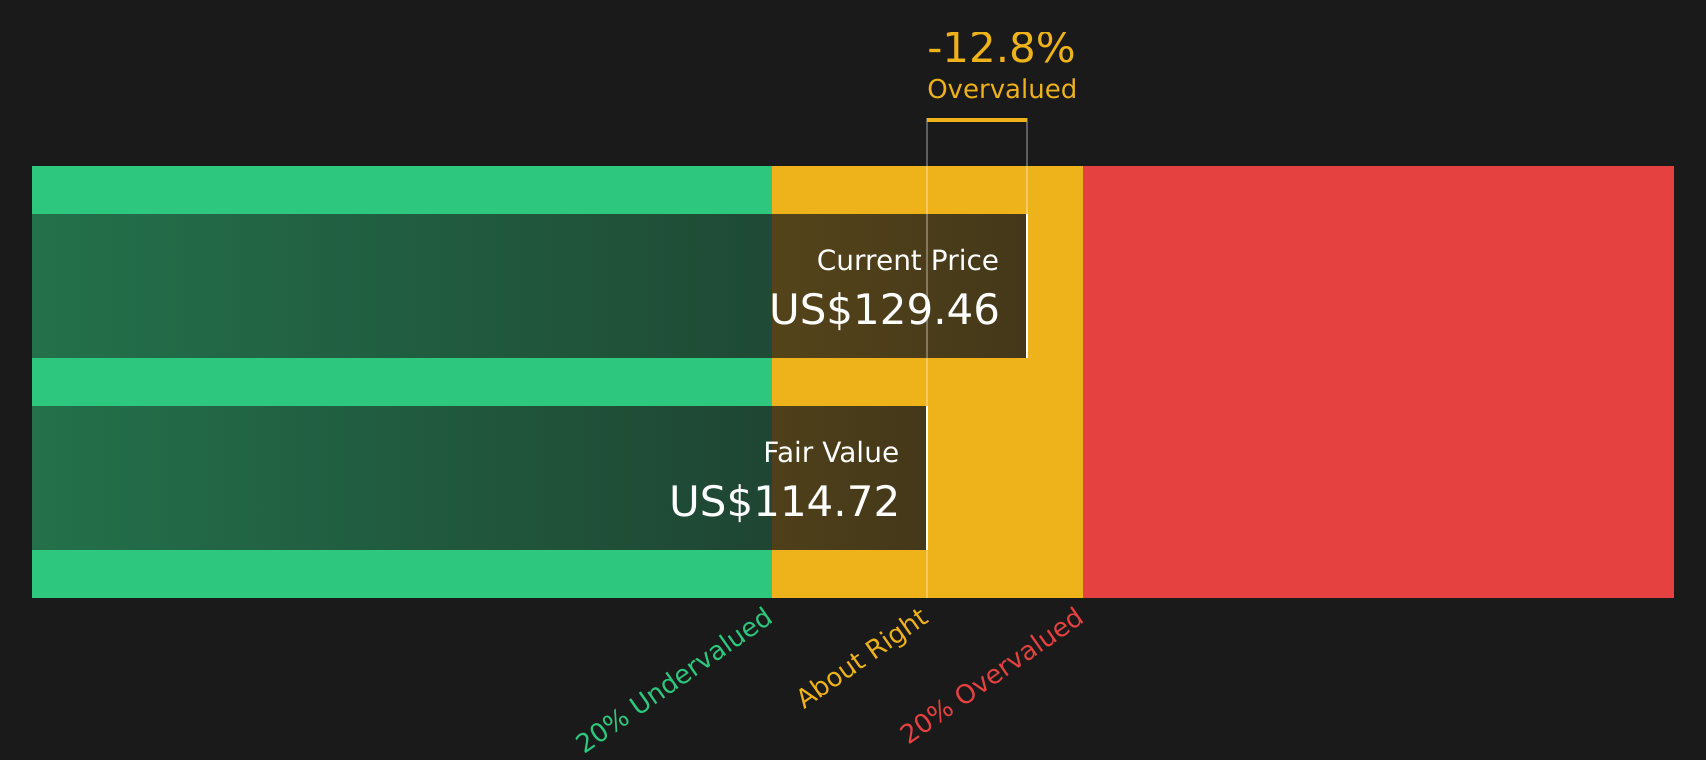
When all the discounted cash flows are combined, the estimated intrinsic value is about $114.76 per share. Compared with a recent share price of around $127.64, the model suggests Fortinet trades at about an 11.2% premium to this DCF estimate, and on this measure the stock currently screens as overvalued.
Result: OVERVALUED
Our Discounted Cash Flow (DCF) analysis suggests Fortinet may be overvalued by 11.2%. Discover 54 high quality undervalued stocks or create your own screener to find better value opportunities.
Approach 2: Fortinet Price vs Earnings
For profitable companies, the P/E ratio is a useful way to see how much you are paying for each dollar of current earnings, which makes it a straightforward cross check on the DCF view.
What counts as a “normal” P/E depends on what investors expect from a company’s earnings and how risky those earnings appear. Higher expected growth and lower perceived risk usually support a higher P/E, while lower growth expectations or higher risk tend to justify a lower multiple.
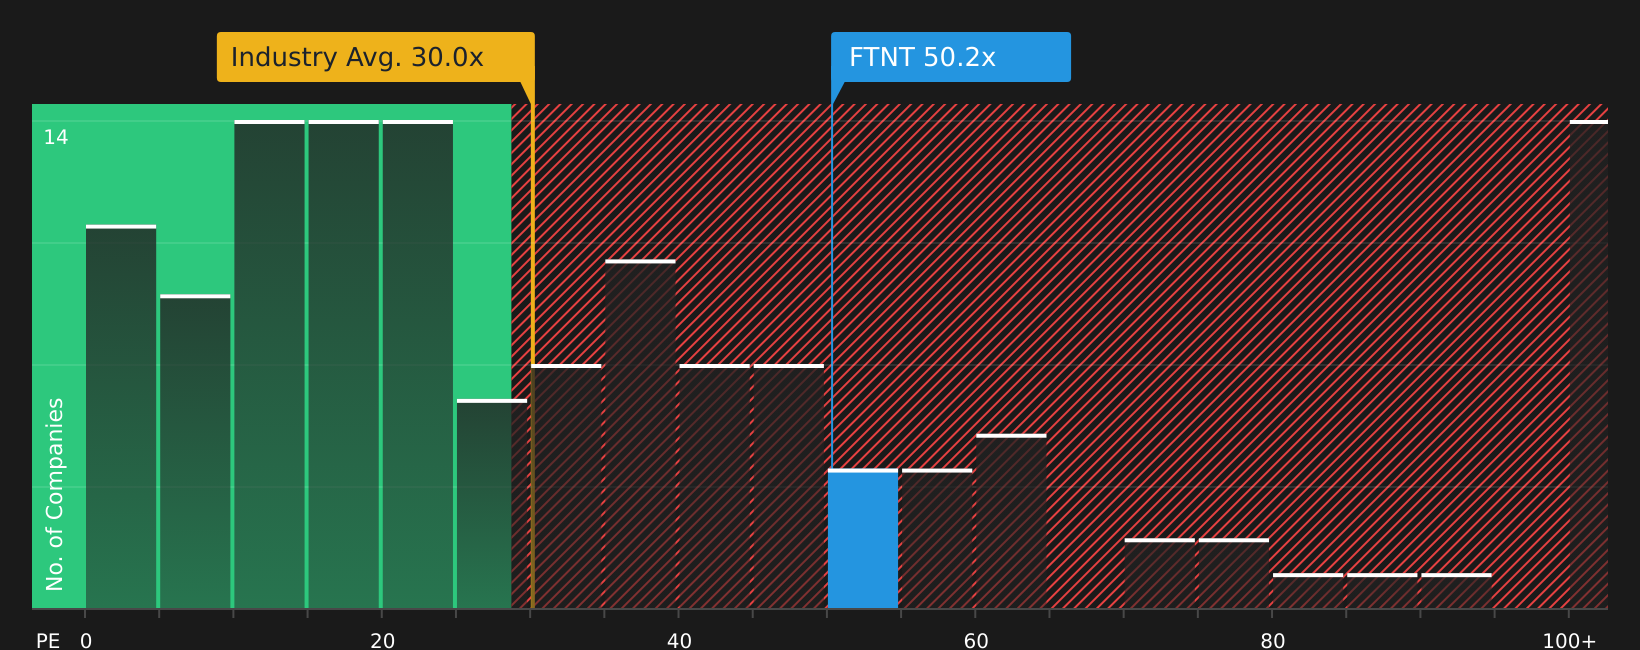
Fortinet currently trades on a P/E of 47.85x. That sits above the broader Software industry average P/E of 26.74x, but below the peer group average of 64.77x. Simply Wall St also calculates a “Fair Ratio” of 33.25x for Fortinet, which is the P/E level that its model suggests could be appropriate given factors such as earnings growth, margins, industry, market cap and company specific risks.
This Fair Ratio is more tailored than a simple comparison with peers or industry averages, because it adjusts for Fortinet’s own characteristics rather than assuming all companies should trade on the same multiple. Comparing the Fair Ratio of 33.25x with the actual P/E of 47.85x, the stock currently screens as overvalued on this metric.
Result: OVERVALUED
P/E ratios tell one story, but what if the real opportunity lies elsewhere? Start investing in legacies, not executives. Discover our 19 top founder-led companies.
Upgrade Your Decision Making: Choose your Fortinet Narrative
Earlier it was mentioned that there is an even better way to think about valuation, and that is where Narratives come in, giving you a simple story that links your view of Fortinet to a full forecast and a Fair Value that can be compared with the current price.
A Narrative is your own explanation of what you think is happening at a company, then translated into numbers such as future revenue, earnings and margins, so you are not just reacting to a P/E screen but working from a clear, consistent story.
On Simply Wall St this is built into the Community page and is designed to be easy to use. You can pick or adjust assumptions rather than build a valuation model from scratch, and then see a Fair Value that updates when new data like earnings or news is added.
For Fortinet, one investor might plug in a Fair Value around US$67.76 based on more cautious revenue and margin assumptions, while another might see closer to US$110.39 as reasonable using stronger growth expectations. By setting up these Narratives side by side you can quickly see which story you align with and how that compares to the current share price.
Do you think there's more to the story for Fortinet? Head over to our Community to see what others are saying!

This article by Simply Wall St is general in nature. We provide commentary based on historical data and analyst forecasts only using an unbiased methodology and our articles are not intended to be financial advice. It does not constitute a recommendation to buy or sell any stock, and does not take account of your objectives, or your financial situation. We aim to bring you long-term focused analysis driven by fundamental data. Note that our analysis may not factor in the latest price-sensitive company announcements or qualitative material. Simply Wall St has no position in any stocks mentioned.