Is It Too Late To Consider Cadence Design Systems (CDNS) After Its Strong Multi Year Run?
Cadence Design Systems, Inc. CDNS | 0.00 |
- If you are wondering whether Cadence Design Systems at around US$318 per share still offers solid value, you are not alone. This article is built to help you weigh what that price really represents.
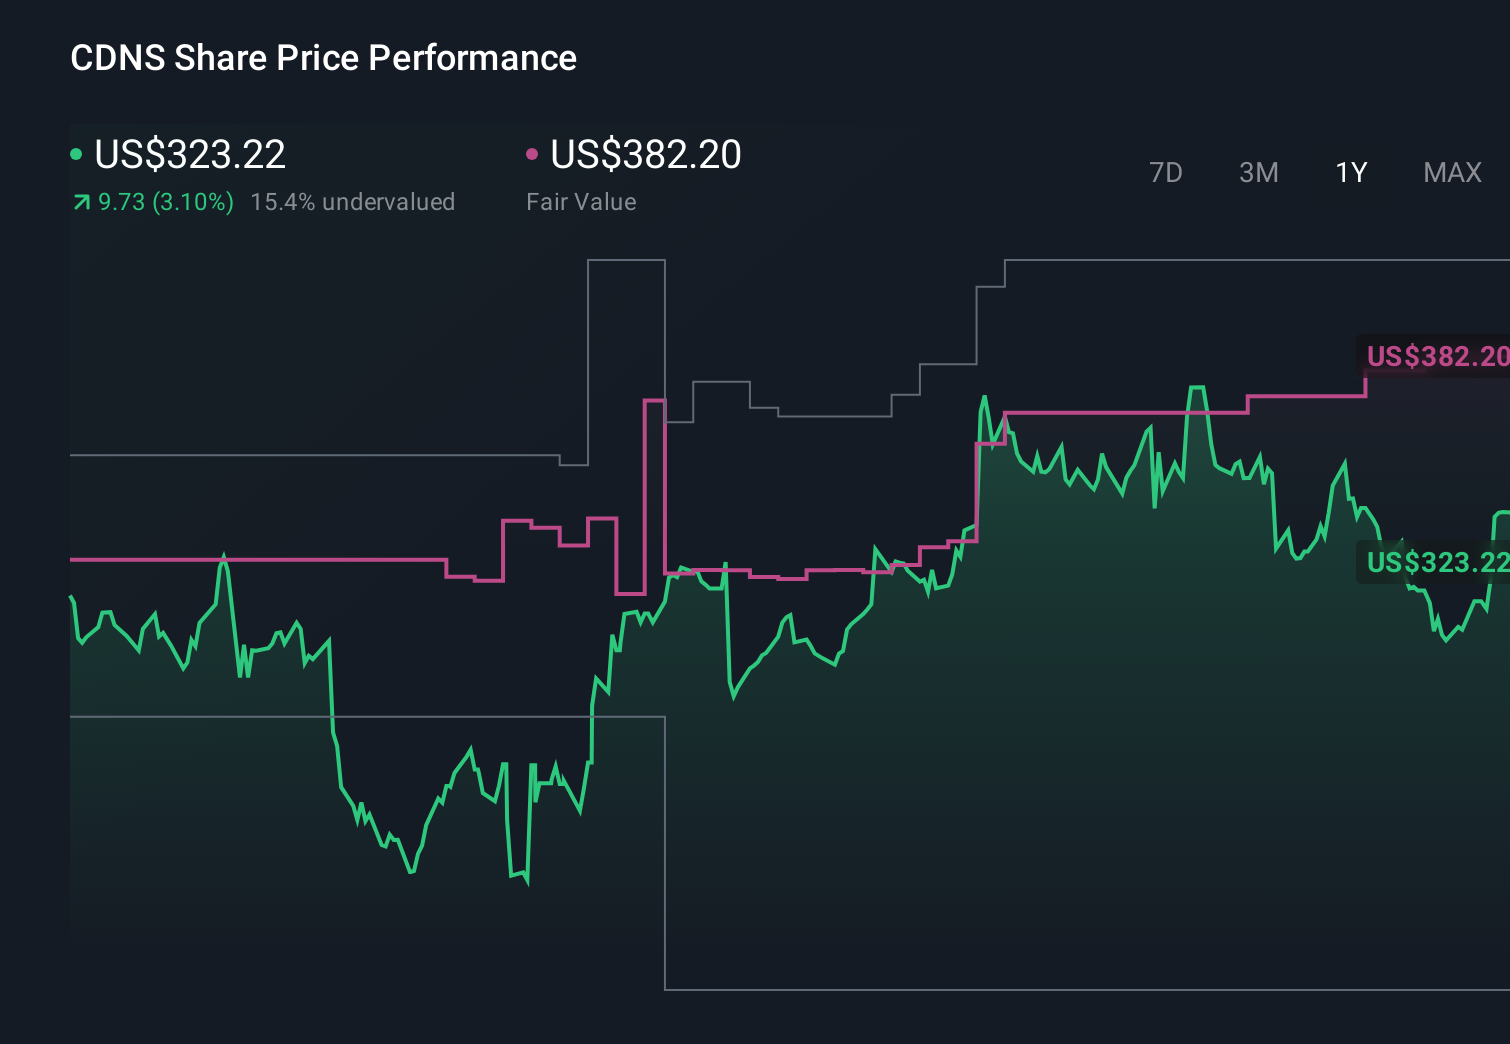
- The stock has delivered a 72.0% return over 3 years and 144.1% over 5 years, while the 1 year return of a 0.7% decline and year to date gain of 2.6% suggest a cooler recent patch after a strong multi year run.
- Recent coverage has focused on Cadence as a key player in design software for complex chips and systems, which keeps it closely watched whenever sentiment around semiconductors shifts. That context helps explain why even modest moves over the last 7 days at 0.3% and 30 days at 0.2% still attract attention from investors tracking the sector closely.
- On Simply Wall St's valuation checks, Cadence scores 1 out of 6 for being assessed as undervalued. Next we will look at what different valuation approaches say about that score and hint at an even richer way to think about value later in the article.
Cadence Design Systems scores just 1/6 on our valuation checks. See what other red flags we found in the full valuation breakdown.
Approach 1: Cadence Design Systems Discounted Cash Flow (DCF) Analysis
A Discounted Cash Flow, or DCF, model looks at the cash Cadence Design Systems is expected to generate in the future and discounts those cash flows back to today, to estimate what the business might be worth in total right now.
Cadence is currently generating trailing twelve month free cash flow of about $1.47b. Using a 2 Stage Free Cash Flow to Equity model, analysts and Simply Wall St projections estimate free cash flow reaching about $3.47b in 2030, with a path of forecast and extrapolated cash flows between 2026 and 2035.
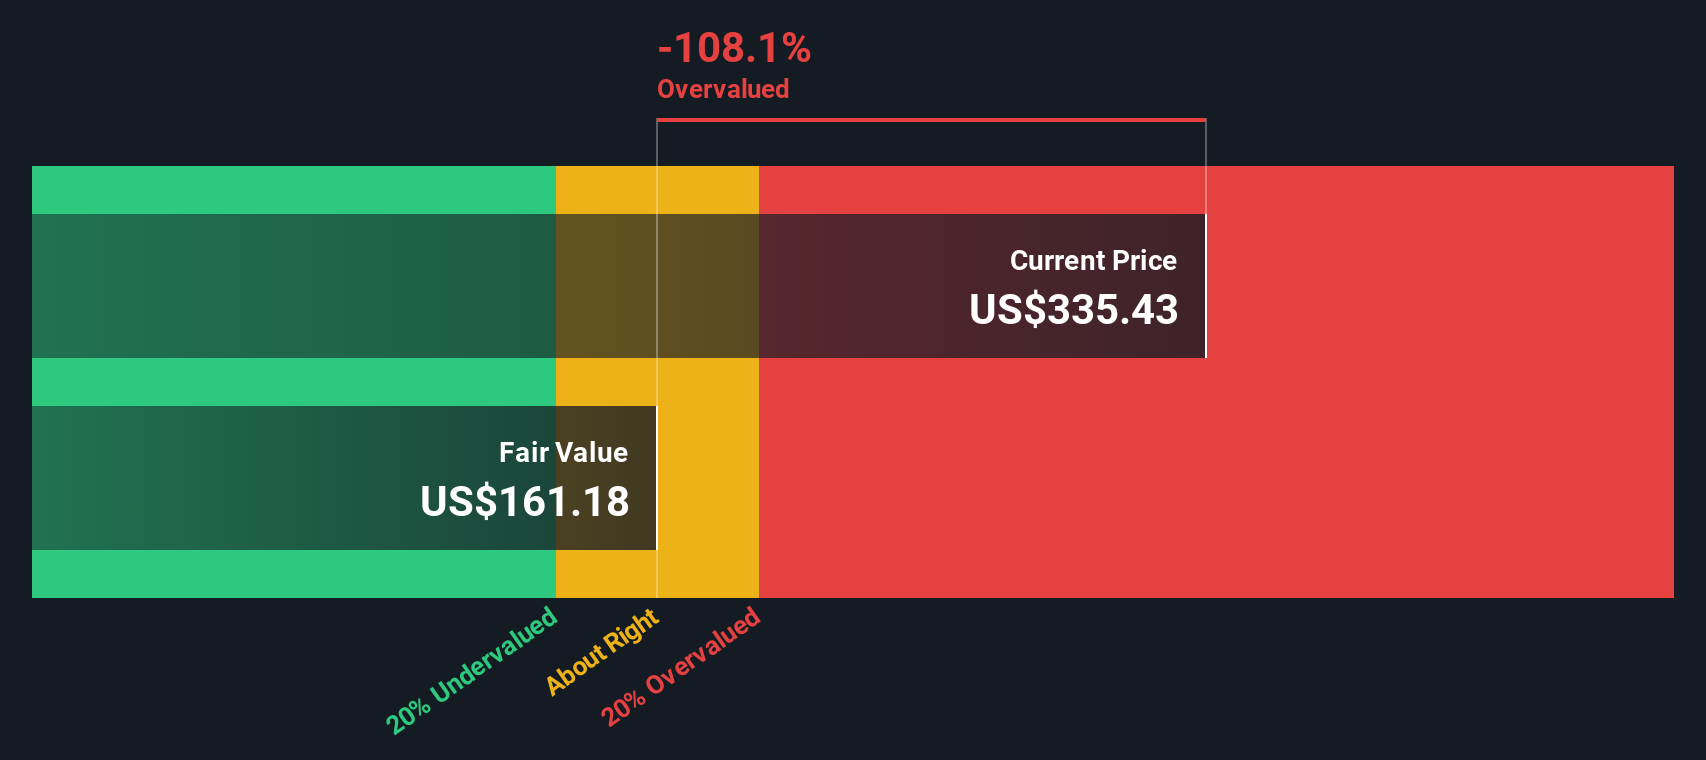
When those projected cash flows are discounted back using this DCF approach, the estimated intrinsic value comes out at about $238.86 per share. Against a current share price around $318, the model implies the stock is about 33.3% overvalued on this basis.
Result: OVERVALUED
Our Discounted Cash Flow (DCF) analysis suggests Cadence Design Systems may be overvalued by 33.3%. Discover 870 undervalued stocks or create your own screener to find better value opportunities.
Approach 2: Cadence Design Systems Price vs Earnings
For a profitable company like Cadence Design Systems, the P/E ratio is a useful way to think about what you are paying for each dollar of current earnings. Investors usually accept a higher P/E when they expect stronger growth or see lower risk, and a lower P/E when they expect slower growth or see higher risk, so the “right” level is rarely one size fits all.
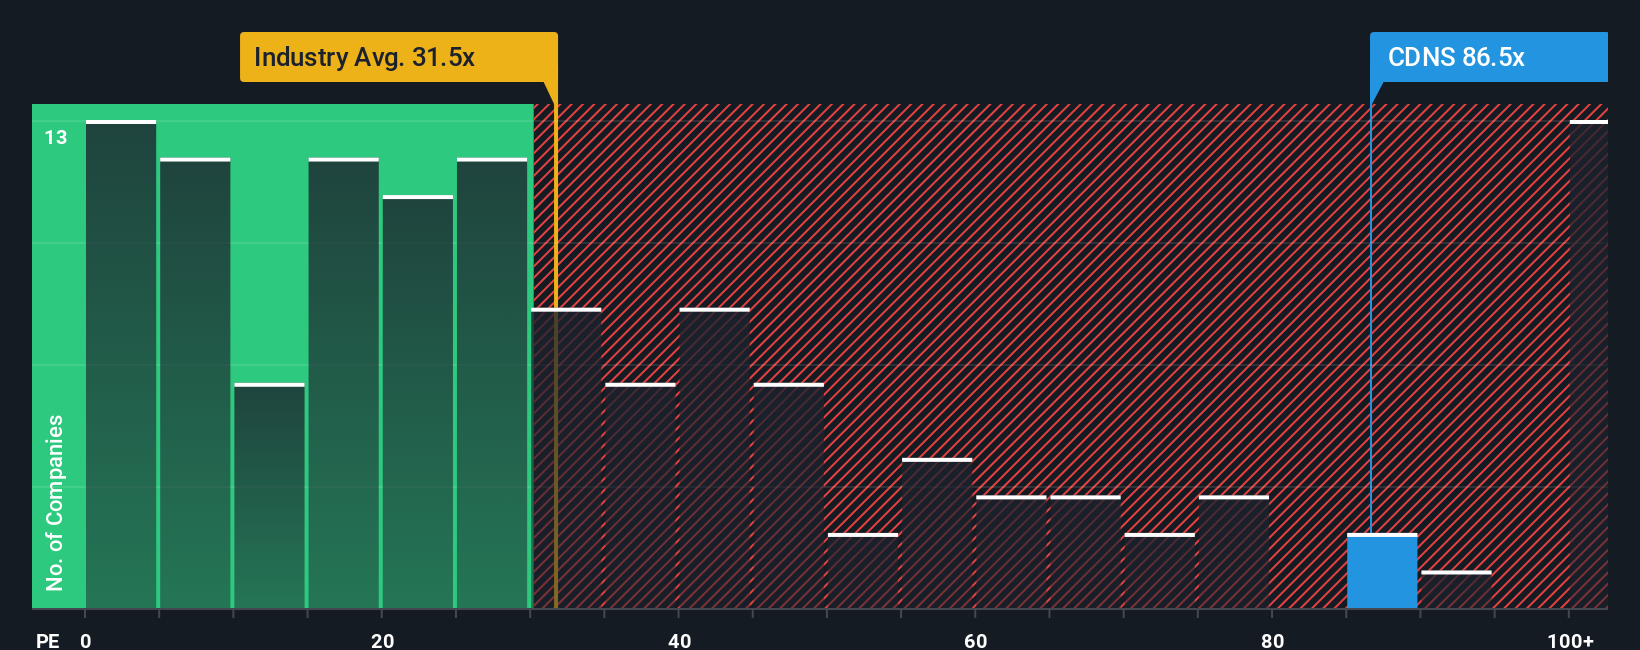
Cadence is trading on a P/E of 81.67x, compared with a Software industry average of 30.51x and a peer average of 54.52x. To go beyond simple comparisons, Simply Wall St uses a “Fair Ratio”, which is the P/E level it would expect for Cadence given factors like its earnings growth profile, industry, profit margins, market cap and risk characteristics. For Cadence, this Fair Ratio is 39.16x.
This Fair Ratio approach can be more informative than lining the stock up against peers or the broad industry because it adjusts for company specific qualities instead of assuming all software names deserve similar multiples. With the actual P/E of 81.67x sitting well above the 39.16x Fair Ratio, the multiple based view points to the shares trading on a rich valuation.
Result: OVERVALUED
P/E ratios tell one story, but what if the real opportunity lies elsewhere? Discover 1432 companies where insiders are betting big on explosive growth.
Upgrade Your Decision Making: Choose your Cadence Design Systems Narrative
Earlier we mentioned that there is an even better way to understand valuation, so let us introduce you to Narratives. These let you put a clear story behind your numbers by linking your view on Cadence Design Systems future revenue, earnings and margins to a financial forecast and then to a fair value on Simply Wall St's Community page. There, millions of investors share and update their Narratives as news or earnings arrive, compare their Fair Value to the current share price to guide their own buy or sell decisions, and sometimes land very far apart. For example, one Cadence Narrative might assume a much higher fair value with faster growth and stronger margins, while another might assume a lower fair value with more cautious forecasts.
Do you think there's more to the story for Cadence Design Systems? Head over to our Community to see what others are saying!
This article by Simply Wall St is general in nature. We provide commentary based on historical data and analyst forecasts only using an unbiased methodology and our articles are not intended to be financial advice. It does not constitute a recommendation to buy or sell any stock, and does not take account of your objectives, or your financial situation. We aim to bring you long-term focused analysis driven by fundamental data. Note that our analysis may not factor in the latest price-sensitive company announcements or qualitative material. Simply Wall St has no position in any stocks mentioned.