Is It Too Late To Consider Cadence Design Systems (CDNS) After Strong Multi‑Year Gains?
Cadence Design Systems, Inc. CDNS | 0.00 |
- For readers considering whether Cadence Design Systems at around US$340.94 is still priced for opportunity or already reflects high expectations, this article explains what the current market price may be indicating about the stock.
- The share price data shows returns of 2.4% over 7 days, 21.7% over 30 days, 9.8% year to date and 10.6% over 1 year, with longer-term figures of 66.1% over 3 years and 164.2% over 5 years.
- Recent coverage has highlighted Cadence Design Systems' role as a key software provider to the semiconductor and electronics design industry, together with investor interest in companies linked to chip design and AI infrastructure. That attention provides important context for how sentiment and expectations can feed into the current share price.
- On Simply Wall St's 6-point valuation framework, Cadence Design Systems currently records a value score of 0 out of 6. The rest of this article will compare several valuation approaches and then finish with a broader way to think about what the market might be pricing in.
Cadence Design Systems scores just 0/6 on our valuation checks. See what other red flags we found in the full valuation breakdown.
Approach 1: Cadence Design Systems Discounted Cash Flow (DCF) Analysis
A Discounted Cash Flow, or DCF, model takes estimates of a company’s future cash flows and discounts them back to today’s dollars to arrive at an estimate of intrinsic value per share.
For Cadence Design Systems, the model uses a 2 Stage Free Cash Flow to Equity approach. The latest twelve month free cash flow is about $1.45b. Analyst inputs and subsequent extrapolations by Simply Wall St project free cash flow reaching about $2.81b in 2030, with interim annual projections between 2026 and 2035 ranging from roughly $1.72b to $3.51b before discounting.
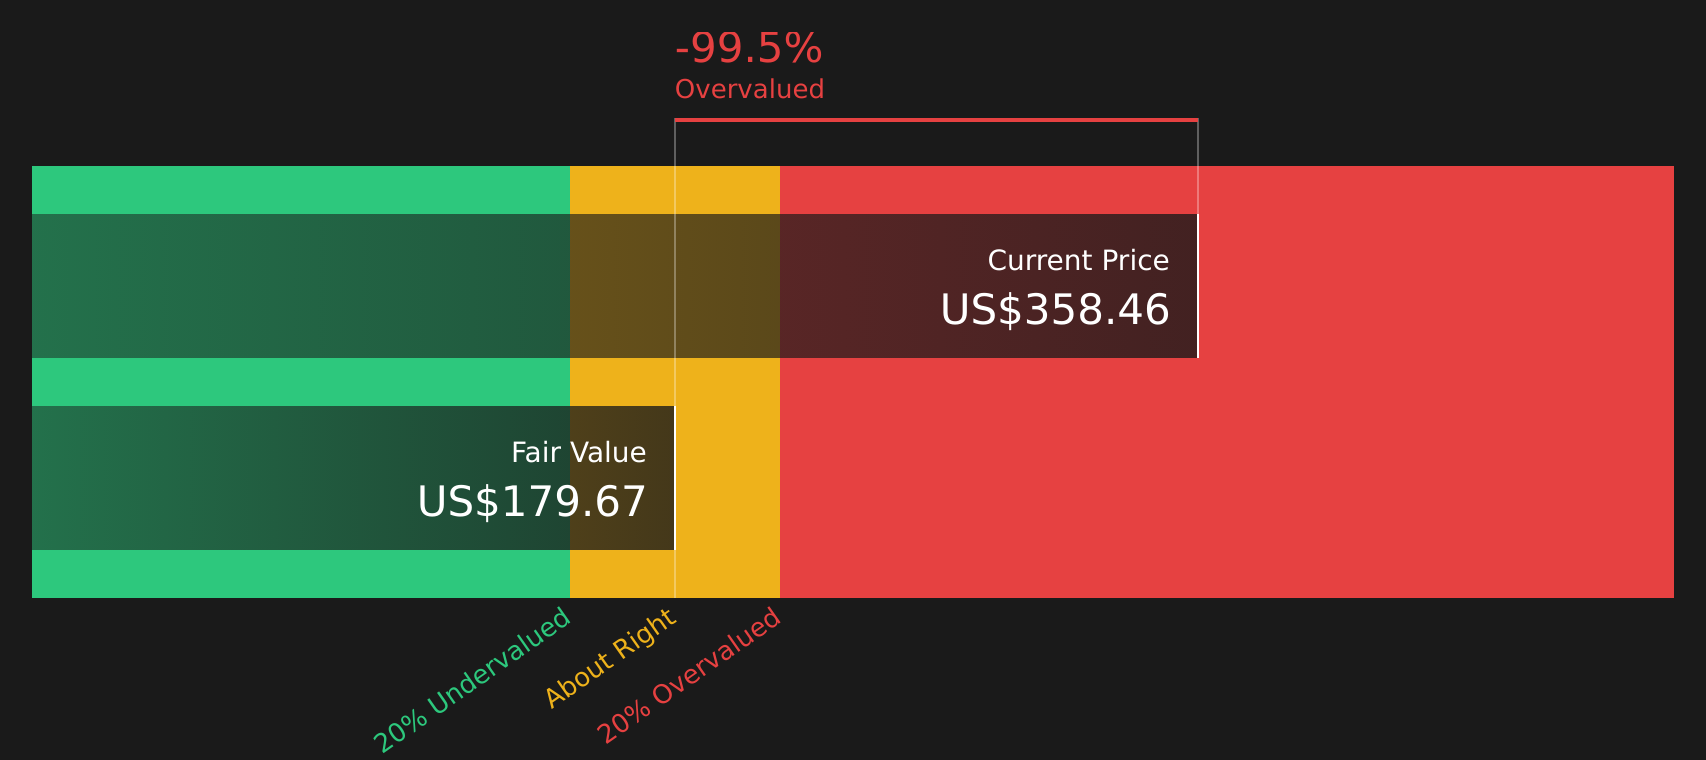
After discounting these projected cash flows back to today, the DCF model produces an estimated fair value of about $177.21 per share. Compared with the current market price around $340.94, this model suggests the shares are about 92.4% above the estimated fair value.
Result: OVERVALUED
Our Discounted Cash Flow (DCF) analysis suggests Cadence Design Systems may be overvalued by 92.4%. Discover 51 high quality undervalued stocks or create your own screener to find better value opportunities.
Approach 2: Cadence Design Systems Price vs Earnings
For profitable companies, the P/E ratio is a straightforward way to connect what you pay for each share with the earnings that support that price. It helps you see how many dollars of price the market is attaching to each dollar of current earnings.
What counts as a “normal” or “fair” P/E often reflects how the market views a company’s growth potential and risk. Higher growth or perceived resilience can justify a higher multiple, while slower growth or higher risk usually points to a lower one.
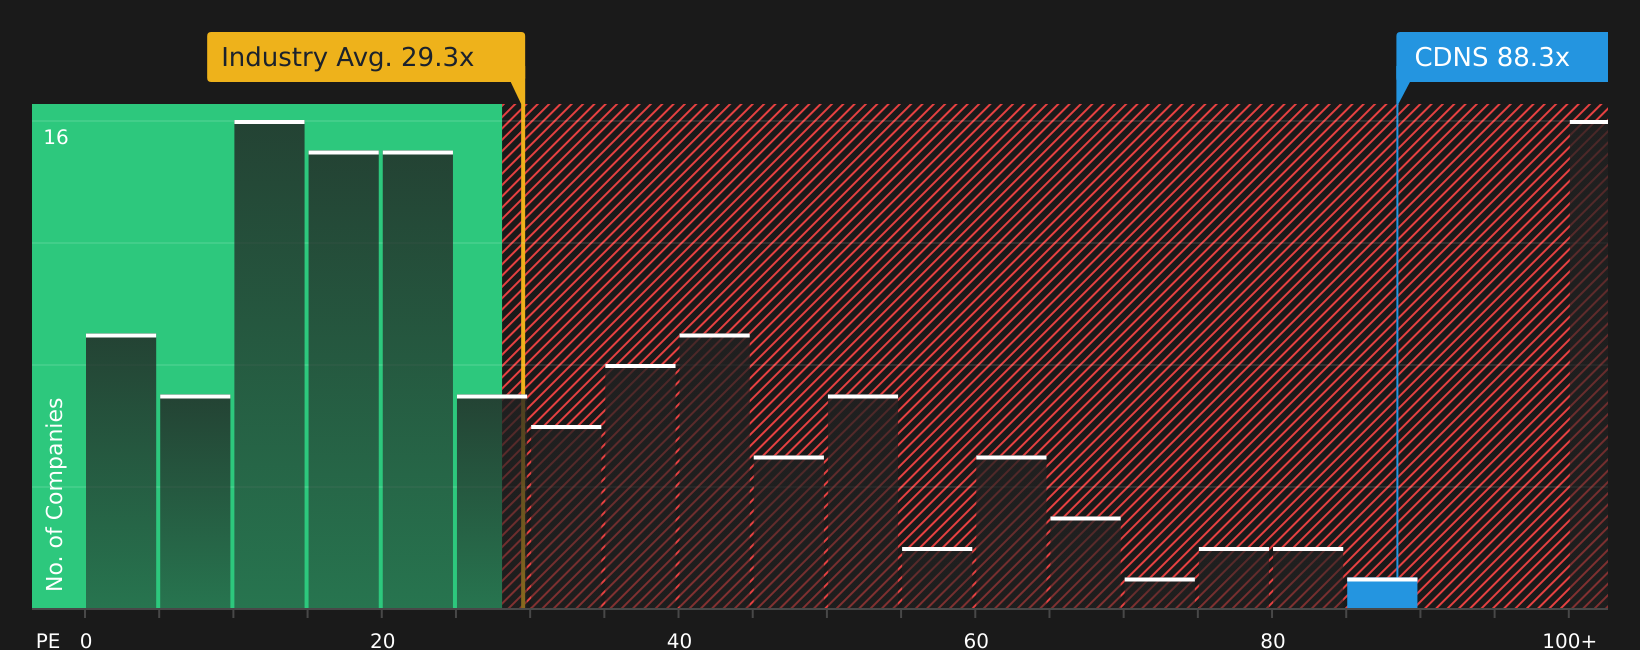
Cadence Design Systems currently trades on a P/E of 80.39x. That is well above the Software industry average of 30.34x and also above the peer group average of 36.10x. Simply Wall St’s Fair Ratio framework estimates a P/E of 33.19x for Cadence Design Systems. This proprietary Fair Ratio aims to capture what a reasonable multiple might be given factors such as earnings growth profile, industry, profit margins, company size and risk characteristics.
Because it adjusts for these company specific factors, the Fair Ratio can offer a more tailored reference point than a simple comparison with peers or the broad industry. Comparing the current 80.39x P/E to the 33.19x Fair Ratio suggests the shares are pricing in much higher expectations than this model implies.
Result: OVERVALUED
P/E ratios tell one story, but what if the real opportunity lies elsewhere? Start investing in legacies, not executives. Discover our 18 top founder-led companies.
Upgrade Your Decision Making: Choose your Cadence Design Systems Narrative
Earlier it was mentioned that there is an even better way to understand valuation, so Narratives are introduced as a simple way for you to attach a clear story about Cadence Design Systems to the numbers you care about, by linking your view on its future revenue, earnings and margins to a financial forecast, an assumed fair value and then a comparison with the current share price.
On Simply Wall St’s Community page, Narratives are available as an accessible tool used by millions of investors. They allow you to pick or adapt a storyline that fits your view, such as a more optimistic case that points to a fair value near US$418.00 or a more cautious case closer to US$316.06. You can then see in one place how that translates into a fair value versus price gap and what that might imply about whether the stock looks expensive or cheap to you.
Because each Narrative is tied to real inputs like revenue growth rates, profit margins, discount rates and future P/E assumptions, it becomes easier to see why different investors can hold very different conclusions about the same company. Those Narratives are refreshed automatically when new information such as earnings updates, analyst revisions or major news is added, so that your chosen story and fair value stay aligned with the latest data rather than going stale.
For Cadence Design Systems however we will make it really easy for you with previews of two leading Cadence Design Systems Narratives:
Fair value in this bullish Narrative: US$371.68 per share
Implied pricing gap vs last close: about 8.3% below that fair value
Revenue growth assumption: 14.19% a year
- AI focused design tools, partnerships with large chip and cloud providers, and a growing IP business are central to the thesis.
- Forecasts rely on revenue growing in the mid teens, profit margins moving into the mid 20s, and earnings reaching about US$2.1b by 2029.
- Analysts backing this view see the current price as leaving room up to a consensus target around US$371.68, but they also flag execution, geopolitical and integration risks.
Fair value in this cautious Narrative: US$316.06 per share
Implied pricing gap vs last close: about 7.9% above that fair value
Revenue growth assumption: 11.44% a year
- This view highlights pressure from open source and low cost rivals, customer concentration and export controls as key issues that could affect growth and margins.
- It builds around slower revenue growth, slightly lower profit margins and earnings of about US$1.6b by 2029, together with a high P/E assumption to support the fair value.
- The thesis accepts that AI, chip complexity and new partnerships help earnings quality, but questions how much of that is already reflected in the share price.
If you want to see how other investors are balancing these bullish and cautious angles, you can review the wider set of community views and supporting numbers in one place through the Narratives tool, then decide which storyline best matches your own expectations for Cadence Design Systems.See what the community is saying about Cadence Design Systems
Do you think there's more to the story for Cadence Design Systems? Head over to our Community to see what others are saying!

This article by Simply Wall St is general in nature. We provide commentary based on historical data and analyst forecasts only using an unbiased methodology and our articles are not intended to be financial advice. It does not constitute a recommendation to buy or sell any stock, and does not take account of your objectives, or your financial situation. We aim to bring you long-term focused analysis driven by fundamental data. Note that our analysis may not factor in the latest price-sensitive company announcements or qualitative material. Simply Wall St has no position in any stocks mentioned.