Is It Too Late To Consider Ciena (CIEN) After A 202% One Year Surge?
Ciena Corporation CIEN | 447.76 | +7.79% |
- If you are wondering whether Ciena's share price still offers value after a strong run, this article will walk through what the current number actually implies.
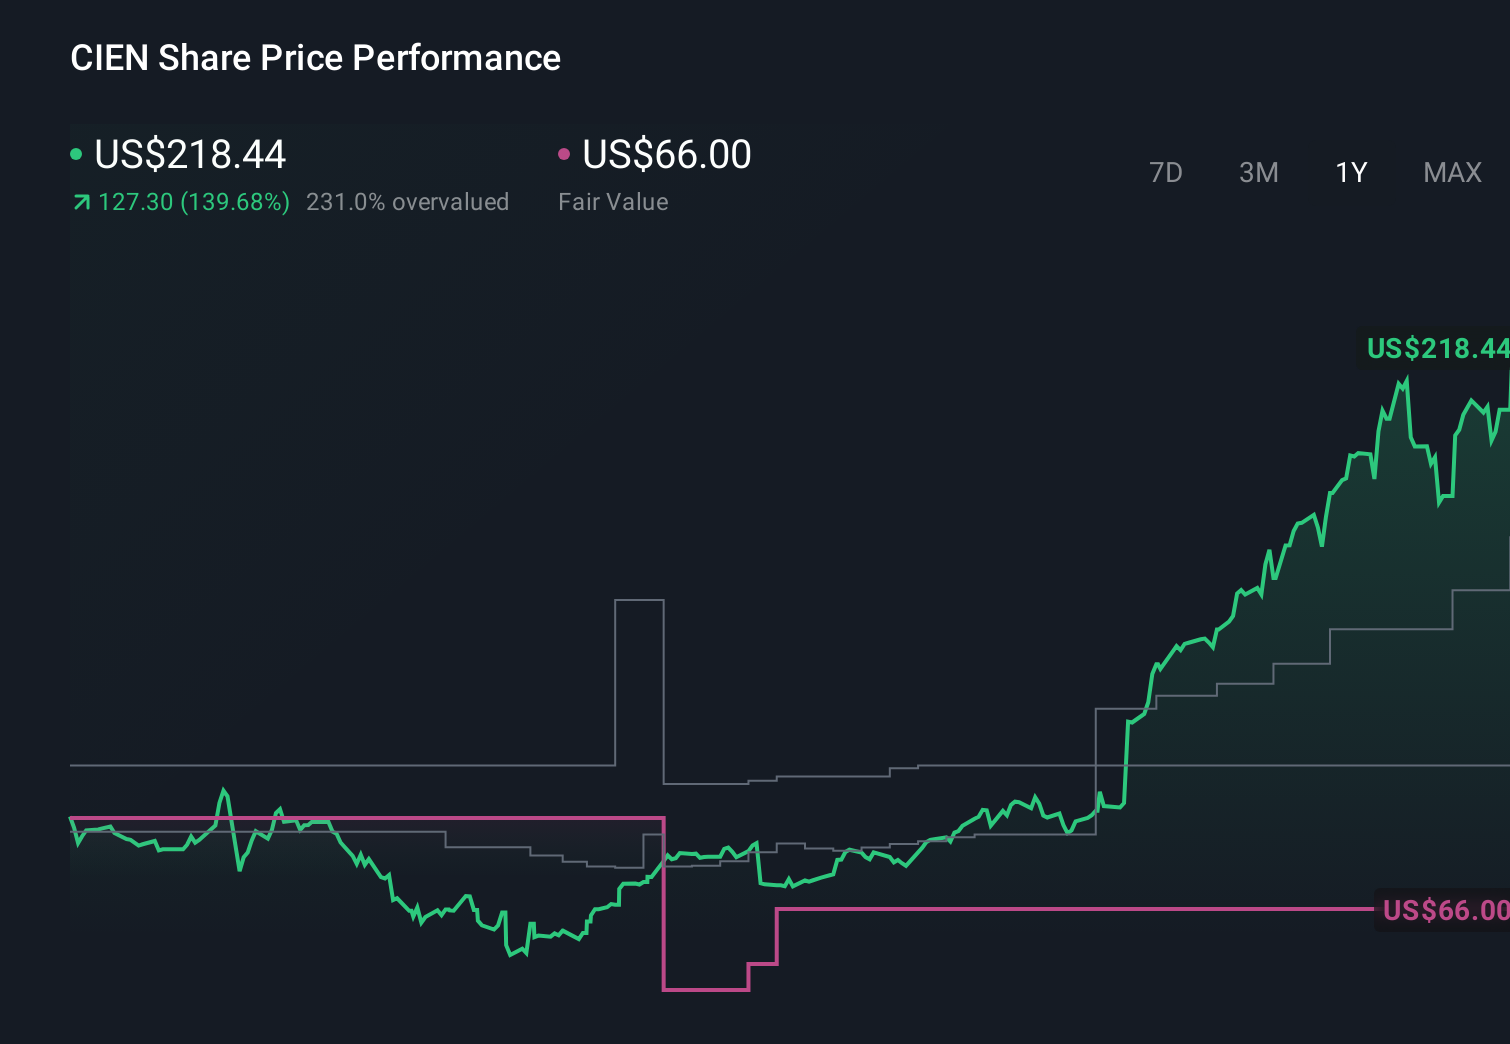
- Over the last week the stock returned 7.7%, with 17.7% over 30 days, 10.3% year to date and 202.4% over the past year. These recent moves may have changed how you think about its risk and return trade off.
- Recent news around Ciena has focused on its role in high capacity networking and telecommunications equipment, with attention on how its technology is used to support data traffic and connectivity. This context helps explain why the market is paying close attention to the stock price and its sensitivity to sector demand.
- Ciena currently scores 1 out of 6 on our valuation checks. Next we will look at what different valuation methods say about that score and then consider an additional way to frame valuation at the end of the article.
Ciena scores just 1/6 on our valuation checks. See what other red flags we found in the full valuation breakdown.
Approach 1: Ciena Discounted Cash Flow (DCF) Analysis
A Discounted Cash Flow, or DCF, model estimates what a business could be worth by projecting its future cash flows and then discounting those back to today’s value using a required rate of return.
For Ciena, the model used is a 2 Stage Free Cash Flow to Equity approach built on cash flow projections in $. The latest twelve month free cash flow is about $667.6 million. Analyst inputs and subsequent extrapolations run through to 2035, with projected free cash flow of $683.264 million in 2030 and discounted values supplied for each year from 2026 to 2035.
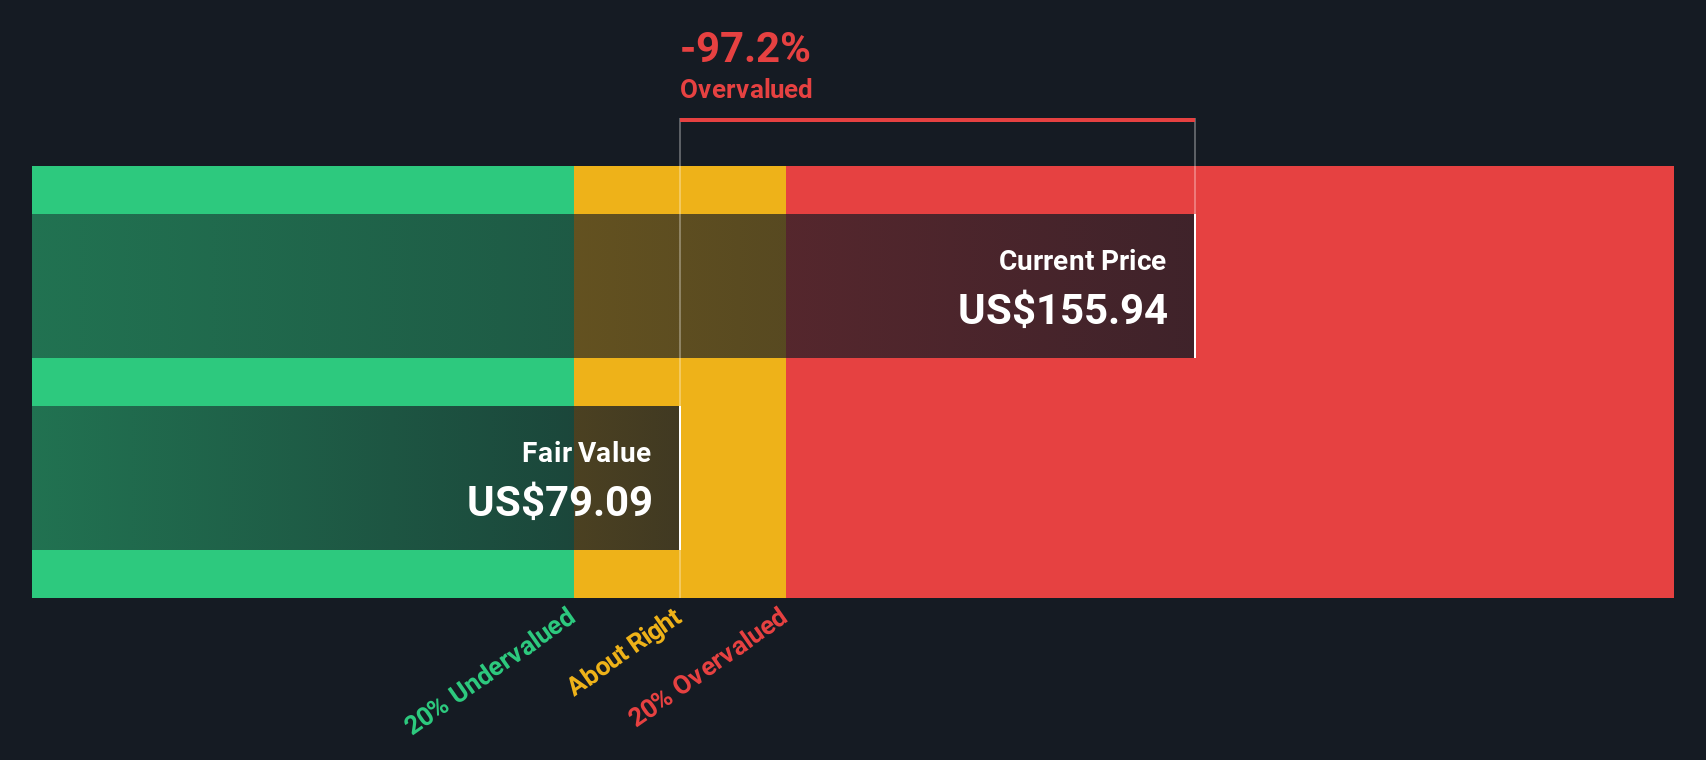
Bringing all those discounted cash flows together gives an estimated intrinsic value of $80.76 per share under this DCF model. Compared with the current share price, the model implies the stock is 236.0% overvalued. Under this framework, this points to a rich pricing for Ciena at the moment.
Result: OVERVALUED
Our Discounted Cash Flow (DCF) analysis suggests Ciena may be overvalued by 236.0%. Discover 53 high quality undervalued stocks or create your own screener to find better value opportunities.
Approach 2: Ciena Price vs Sales
Price based multiples are often useful for profitable companies because they give you a quick sense of how much investors are paying for each unit of the business, such as earnings, sales or book value. For Ciena, P/S is the preferred yardstick, as it focuses on revenue rather than accounting earnings or balance sheet values.
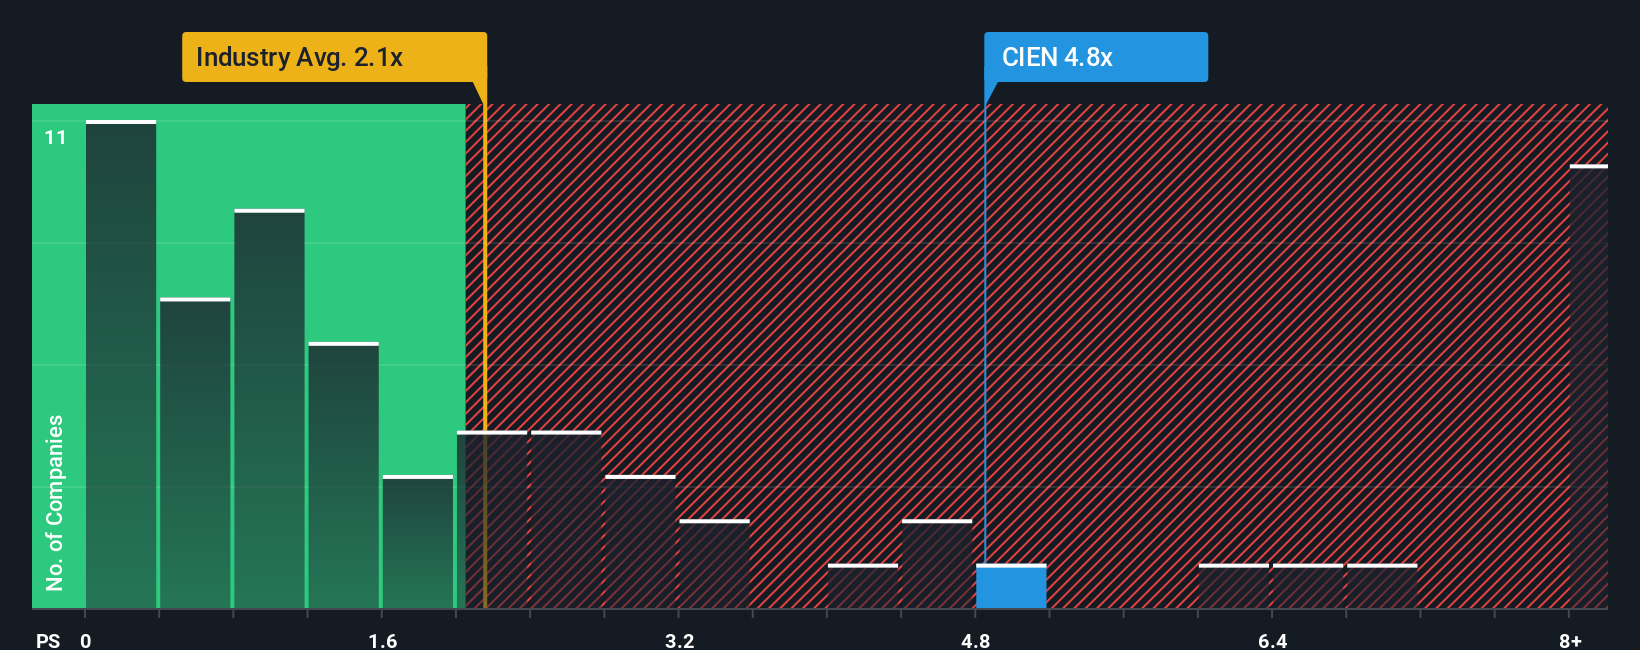
In general, higher growth expectations and lower perceived risk can support a higher “normal” or “fair” multiple. Slower growth and higher risk usually point to a lower one. Ciena currently trades on a P/S of 8.01x. That is above the Communications industry average P/S of 1.99x and below the peer group average of 10.65x.
Simply Wall St’s Fair Ratio for Ciena is 5.12x. This is a proprietary estimate of what a reasonable P/S might be, based on factors such as earnings growth, profit margins, risks, industry and market cap. Compared with a simple industry or peer comparison, the Fair Ratio aims to be more tailored to Ciena’s specific profile. With the actual P/S of 8.01x sitting above the Fair Ratio of 5.12x, this approach points to the shares trading on a richer multiple than would be expected.
Result: OVERVALUED
P/S ratios tell one story, but what if the real opportunity lies elsewhere? Start investing in legacies, not executives. Discover our 22 top founder-led companies.
Upgrade Your Decision Making: Choose your Ciena Narrative
Earlier we mentioned that there is an even better way to understand valuation, so let us introduce you to Narratives. These let you attach a clear story, your view on Ciena’s future revenue, earnings and margins, to the numbers you are using for fair value.
A Narrative links three pieces together in a simple chain: what you think is happening with the business, how that feeds into a financial forecast, and the fair value that follows from that forecast.
On Simply Wall St’s Community page, used by millions of investors, Narratives are an accessible tool where you can set your own assumptions, see the implied fair value, and compare that directly to the current share price to help you decide if Ciena looks expensive or cheap on your terms.
Because Narratives update when new information like news or earnings is added, you can quickly see how the same stock can look different to different investors. For example, one Narrative might see Ciena’s fair value far above today’s price, while another has it well below, based on contrasting views of future growth and profitability.
Do you think there's more to the story for Ciena? Head over to our Community to see what others are saying!
This article by Simply Wall St is general in nature. We provide commentary based on historical data and analyst forecasts only using an unbiased methodology and our articles are not intended to be financial advice. It does not constitute a recommendation to buy or sell any stock, and does not take account of your objectives, or your financial situation. We aim to bring you long-term focused analysis driven by fundamental data. Note that our analysis may not factor in the latest price-sensitive company announcements or qualitative material. Simply Wall St has no position in any stocks mentioned.