Is It Too Late To Consider Commercial Metals (CMC) After A 58% One Year Surge?
Commercial Metals Company CMC | 0.00 |
- If you are wondering whether Commercial Metals at around US$66.17 is still offering value or if most of the opportunity has already been priced in, this article is designed to help you frame that question clearly.
- The stock has seen mixed recent returns, with about 0.6% over the last 7 days, 7.7% over the past month, a year to date return of a 7.8% decline, and 58.2% over the last year, which may have shifted how the market views its potential and risk.
- Recent news coverage has largely focused on Commercial Metals in the context of the wider metals and materials sector, especially around how companies in this space are managing costs and capital allocation. This backdrop gives useful context for the stock's recent moves without tying the story to any single short term event.
- Commercial Metals currently has a valuation score of 5/6, and the sections that follow will walk through what different valuation methods say about that number, before finishing with a broader way to think about what the market price really reflects.
Approach 1: Commercial Metals Discounted Cash Flow (DCF) Analysis
A Discounted Cash Flow, or DCF, model takes the cash that a company is expected to generate in the future, then discounts those amounts back into today’s dollars to estimate what the business might be worth right now.
For Commercial Metals, the model used here is a 2 Stage Free Cash Flow to Equity approach. The latest twelve month Free Cash Flow is about $397.9 million. Analysts provide forecasts for the next few years. Beyond that, Simply Wall St extends the trend to build a ten year view of cash flows. Those projections include Free Cash Flow of $803.95 million in 2028, with further estimated values out to 2035, all expressed in today’s terms using a discount rate.
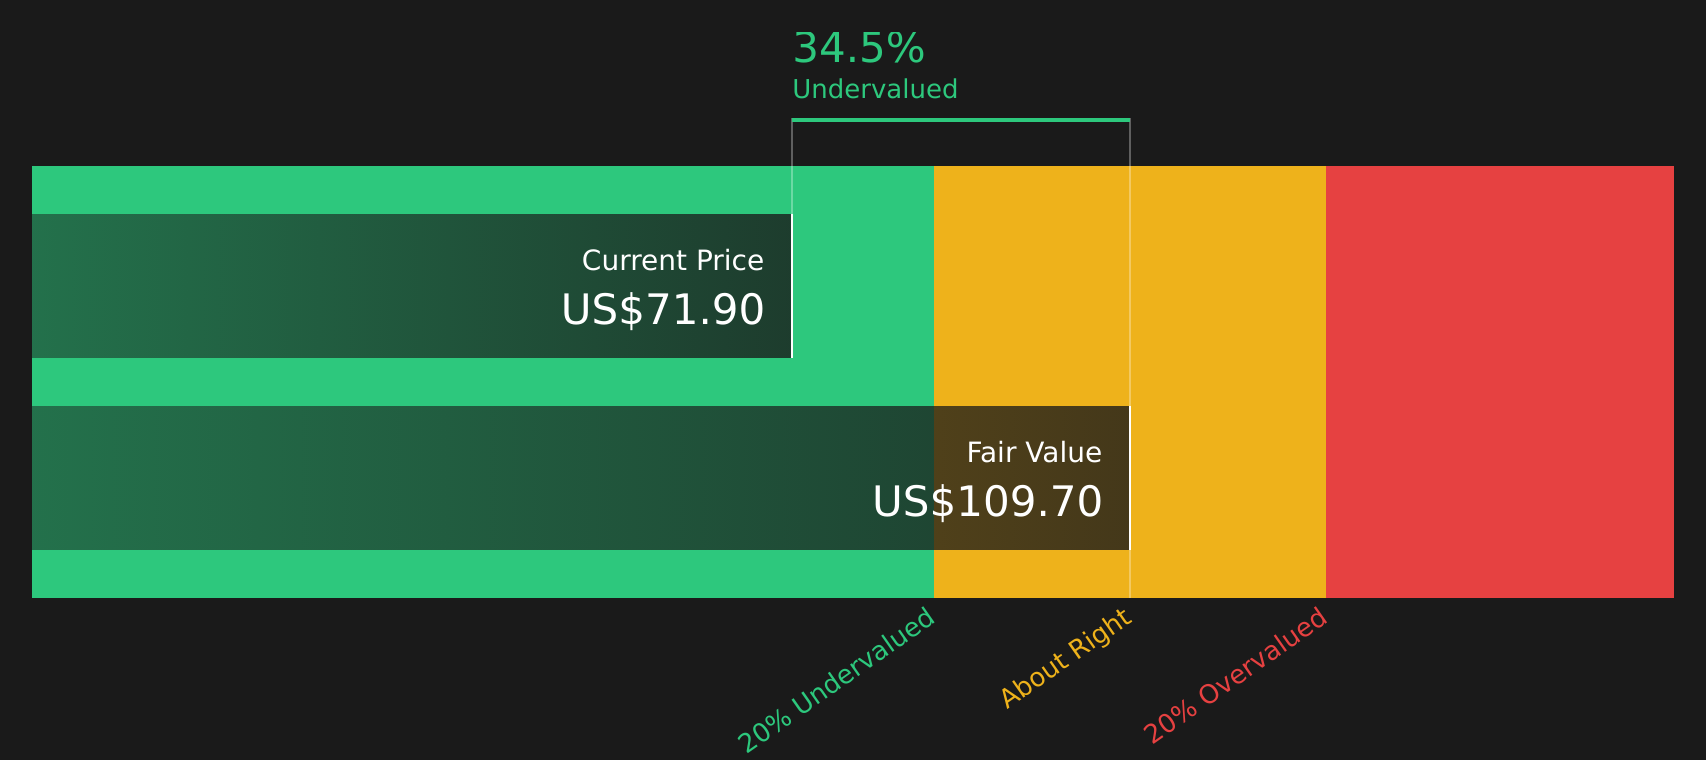
When all of those discounted cash flows are added together, the DCF model suggests an intrinsic value of about $108.35 per share. Compared with the recent share price of around $66.17, this implies the stock is trading at a 38.9% discount to that estimate, which points to a valuation that looks materially cheap on this model alone.
Result: UNDERVALUED
Our Discounted Cash Flow (DCF) analysis suggests Commercial Metals is undervalued by 38.9%. Track this in your watchlist or portfolio, or discover 59 more high quality undervalued stocks.
Approach 2: Commercial Metals Price vs Earnings
P/E is a useful yardstick for profitable companies because it directly links what you pay for each share to the earnings that each share currently generates. It gives you a quick way to see how much the market is willing to pay for those earnings compared with other options.
What counts as a "normal" or "fair" P/E depends on how the market views a company’s growth prospects and risk profile. Higher growth or lower perceived risk can justify a higher P/E, while lower growth or higher risk can point to a lower P/E.
Commercial Metals is trading on a P/E of 14.52x. That sits below the Metals and Mining industry average of 23.09x and well below the indicated peer group average of 43.88x. Simply Wall St also provides a Fair Ratio of 19.82x, which is an estimate of what the P/E could be given factors such as earnings growth, profit margins, industry, market cap and company specific risks.
This Fair Ratio aims to be more tailored than a simple peer or industry comparison because it adjusts for those business characteristics instead of assuming all companies deserve the same multiple. With a current P/E of 14.52x versus a Fair Ratio of 19.82x, the shares screen as undervalued on this metric.
Result: UNDERVALUED

P/E ratios tell one story, but what if the real opportunity lies elsewhere? Start investing in legacies, not executives. Discover our 19 top founder-led companies.
Upgrade Your Decision Making: Choose your Commercial Metals Narrative
Earlier it was mentioned that there is an even better way to understand valuation, so Narratives are introduced here as a simple way for you to attach a clear story about Commercial Metals to a set of numbers. You can link your view on its future revenue, earnings and margins to a financial forecast and a Fair Value, then compare that Fair Value with the current price to help decide whether to act. All of this is done within an easy tool on Simply Wall St's Community page that automatically refreshes when new data such as earnings or news is added. One investor might back a higher Fair Value around US$85 built on expectations of revenue of about US$10.5b, earnings of US$744.9m and a P/E of 15.8x in 2029, while another might anchor closer to US$69 using revenue of US$9.9b, earnings of US$565.2m and a P/E of 16.8x. Narratives sets these side by side so you can see which story you agree with and how your own numbers compare.
Do you think there's more to the story for Commercial Metals? Head over to our Community to see what others are saying!

This article by Simply Wall St is general in nature. We provide commentary based on historical data and analyst forecasts only using an unbiased methodology and our articles are not intended to be financial advice. It does not constitute a recommendation to buy or sell any stock, and does not take account of your objectives, or your financial situation. We aim to bring you long-term focused analysis driven by fundamental data. Note that our analysis may not factor in the latest price-sensitive company announcements or qualitative material. Simply Wall St has no position in any stocks mentioned.