Is It Too Late To Consider Compass (COMP) After Its Strong Multi‑Year Share Price Run?
Compass COMP | 7.07 | -1.53% |
- If you are asking whether Compass at US$12.04 still offers value or has already run too far, this breakdown is written for you.
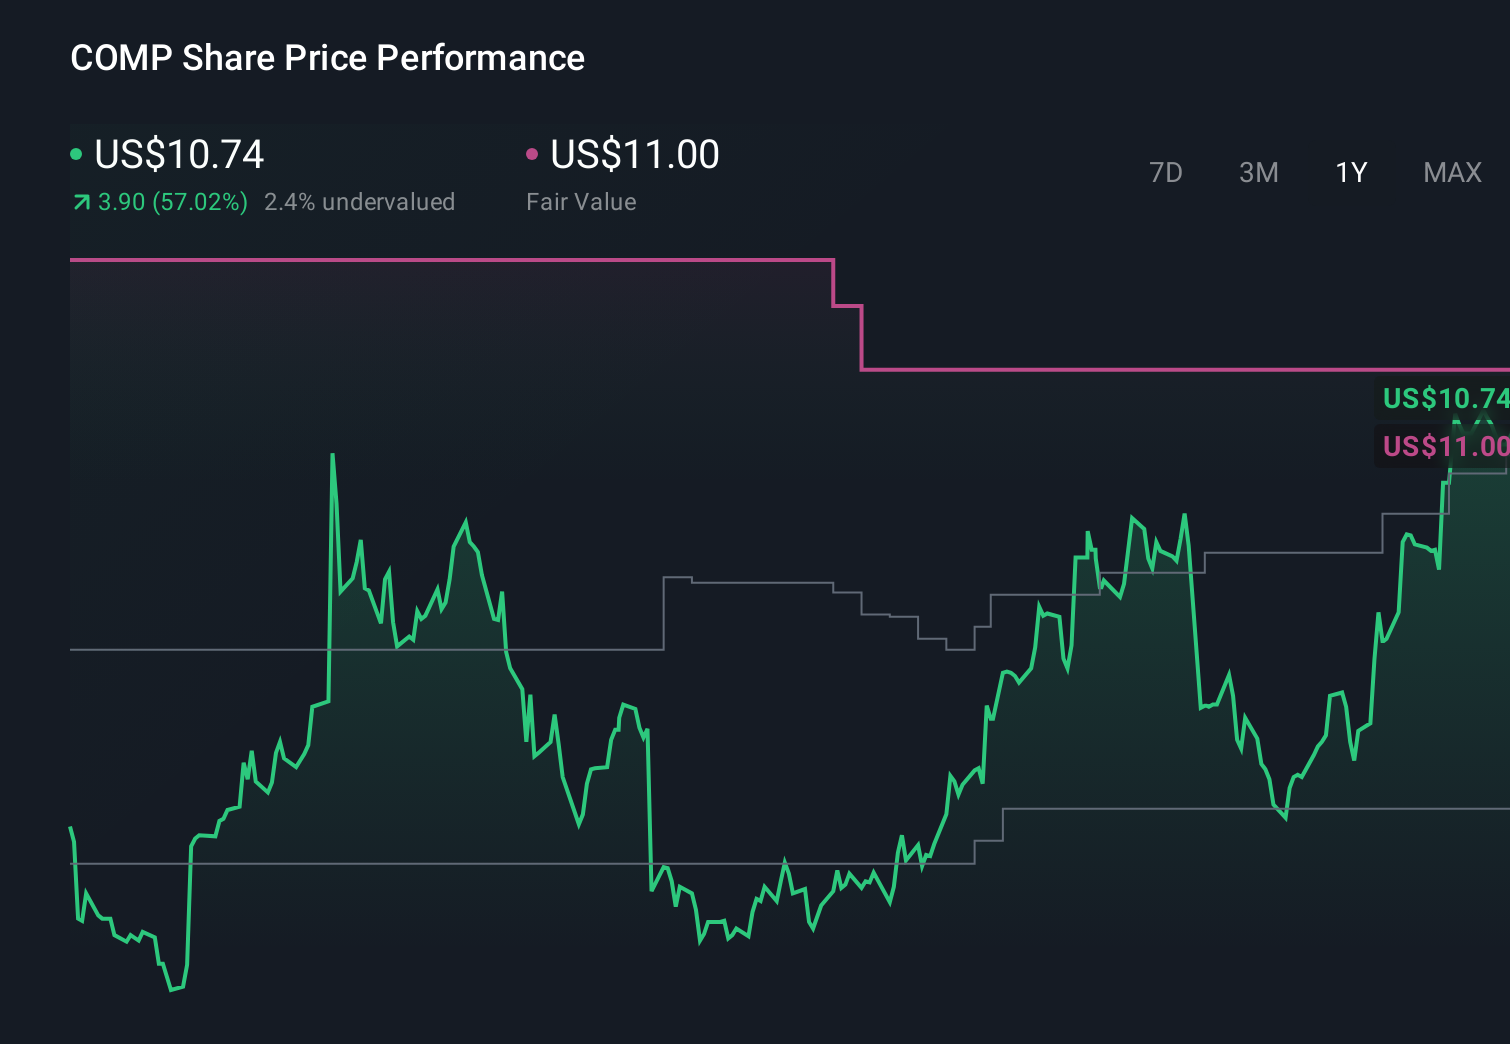
- The stock has seen a 7.6% decline over the last 7 days, but is up 11.2% over 30 days, 14.7% year to date and 58.2% over the past year, with a very large 3 year return of 204.8%. This naturally raises questions about what is already priced in and what is not.
- Recent attention on Compass has centered on its position in the US real estate brokerage space and how investors view its ability to operate through different housing market conditions. This context has shaped how the market reacts to news about transaction volumes, agent count and broader housing sentiment, which helps explain some of the recent price swings.
- Our valuation framework gives Compass a score of 4 out of 6 on undervaluation checks. Next we will look at what that means across different valuation methods, and then finish with a way of thinking about value that goes beyond any single model.
Approach 1: Compass Discounted Cash Flow (DCF) Analysis
A Discounted Cash Flow model estimates what a company might be worth by projecting its future cash flows and discounting them back to today, so you can compare that value with the current share price.
For Compass, the model uses a 2 Stage Free Cash Flow to Equity approach built on cash flow projections. The latest twelve month free cash flow is about $182.1 million, and analysts plus extrapolated estimates suggest free cash flow of $1.091 billion by 2030, with a series of annual projections between those points expressed in today’s dollars.
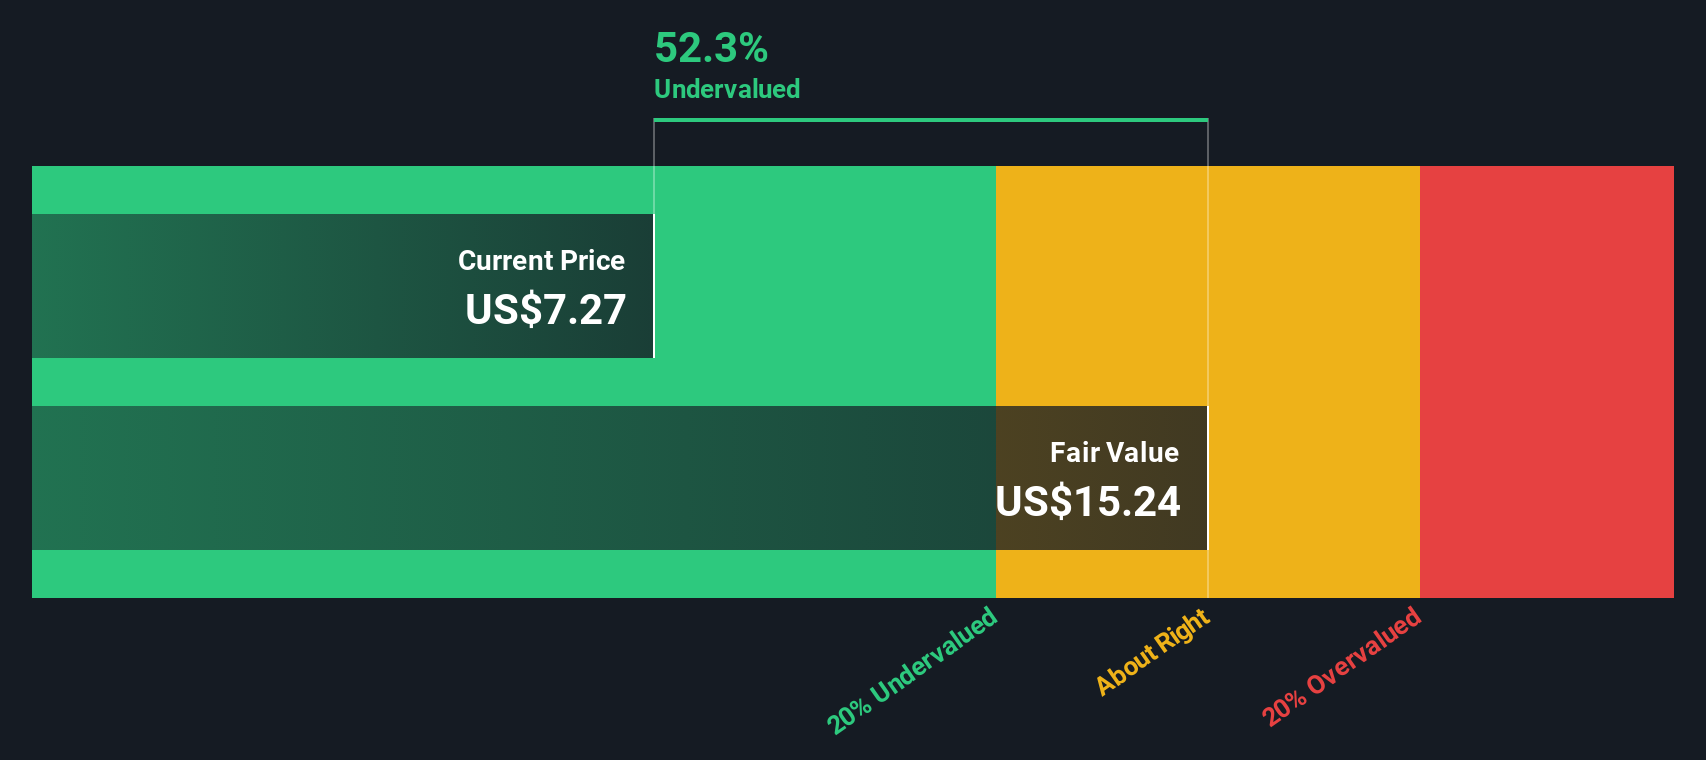
When all those projected cash flows are discounted back and added up, the model arrives at an estimated intrinsic value of US$35.19 per share. Compared with the recent share price of about US$12.04, this implies a 65.8% discount, which indicates that the stock screens as undervalued under this specific set of assumptions.
Result: UNDERVALUED
Our Discounted Cash Flow (DCF) analysis suggests Compass is undervalued by 65.8%. Track this in your watchlist or portfolio, or discover 54 more high quality undervalued stocks.
Approach 2: Compass Price vs Sales (P/S)
For companies where earnings can be volatile, the Price to Sales, or P/S, ratio is often a useful way to compare what investors are paying for each dollar of revenue. It sidesteps short term earnings swings and focuses on the top line.
In general, higher growth expectations and lower perceived risk can justify a higher P/S multiple, while slower growth or higher risk tends to support a lower multiple. So context really matters when you look at any single number.
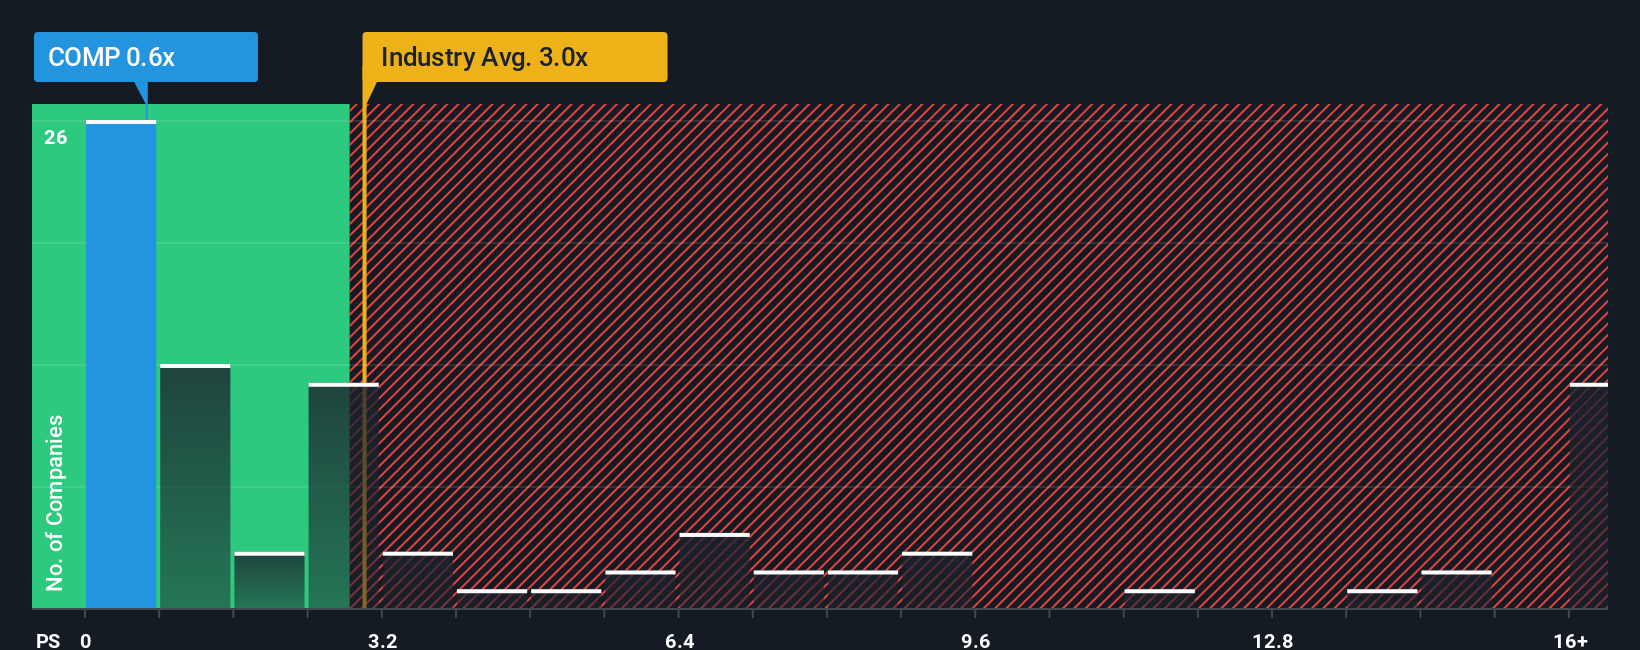
Compass currently trades on a P/S of about 1.02x. That sits below the Real Estate industry average P/S of 2.39x and below the peer group average of 1.78x. Simply Wall St’s Fair Ratio framework estimates a P/S of 0.72x for Compass, based on factors such as growth profile, profit margins, market cap, industry and stock specific risks.
This Fair Ratio is more tailored than a simple comparison to peers or the industry because it adjusts for Compass specific characteristics rather than assuming that all companies deserve the same multiple.
Comparing the Fair Ratio of 0.72x with the current 1.02x P/S suggests the shares screen as overvalued on this measure.
Result: OVERVALUED
P/S ratios tell one story, but what if the real opportunity lies elsewhere? Start investing in legacies, not executives. Discover our 22 top founder-led companies.
Upgrade Your Decision Making: Choose your Compass Narrative
Earlier we mentioned that there is an even better way to understand valuation, so let us introduce you to Narratives, which Simply Wall St hosts on its Community page for millions of investors. A Narrative is your story about a company, where you set out what you think will happen to its revenue, earnings and margins, and link that story to a forecast and a fair value that you can compare directly with today’s share price. Instead of relying only on preset models, you can use Narratives as an easy tool to line up the company’s story, your numbers and a fair value estimate in one place, then see whether that fair value suggests the stock could be cheap or expensive compared to the current price. Narratives are updated when new information like news or earnings is added to the platform, so your view does not stay frozen. For Compass, for example, one investor might enter a Narrative that points to a much higher fair value based on optimistic assumptions, while another might use more cautious inputs that result in a much lower fair value.
Do you think there's more to the story for Compass? Head over to our Community to see what others are saying!
This article by Simply Wall St is general in nature. We provide commentary based on historical data and analyst forecasts only using an unbiased methodology and our articles are not intended to be financial advice. It does not constitute a recommendation to buy or sell any stock, and does not take account of your objectives, or your financial situation. We aim to bring you long-term focused analysis driven by fundamental data. Note that our analysis may not factor in the latest price-sensitive company announcements or qualitative material. Simply Wall St has no position in any stocks mentioned.