Is It Too Late To Consider Cummins (CMI) After Strong Multi Year Share Price Gains
Cummins Inc. CMI | 592.12 | -3.81% |
- Wondering if Cummins at around US$540 a share still offers value, or if most of the easy gains are already behind it? This article walks through what the current price might be implying.
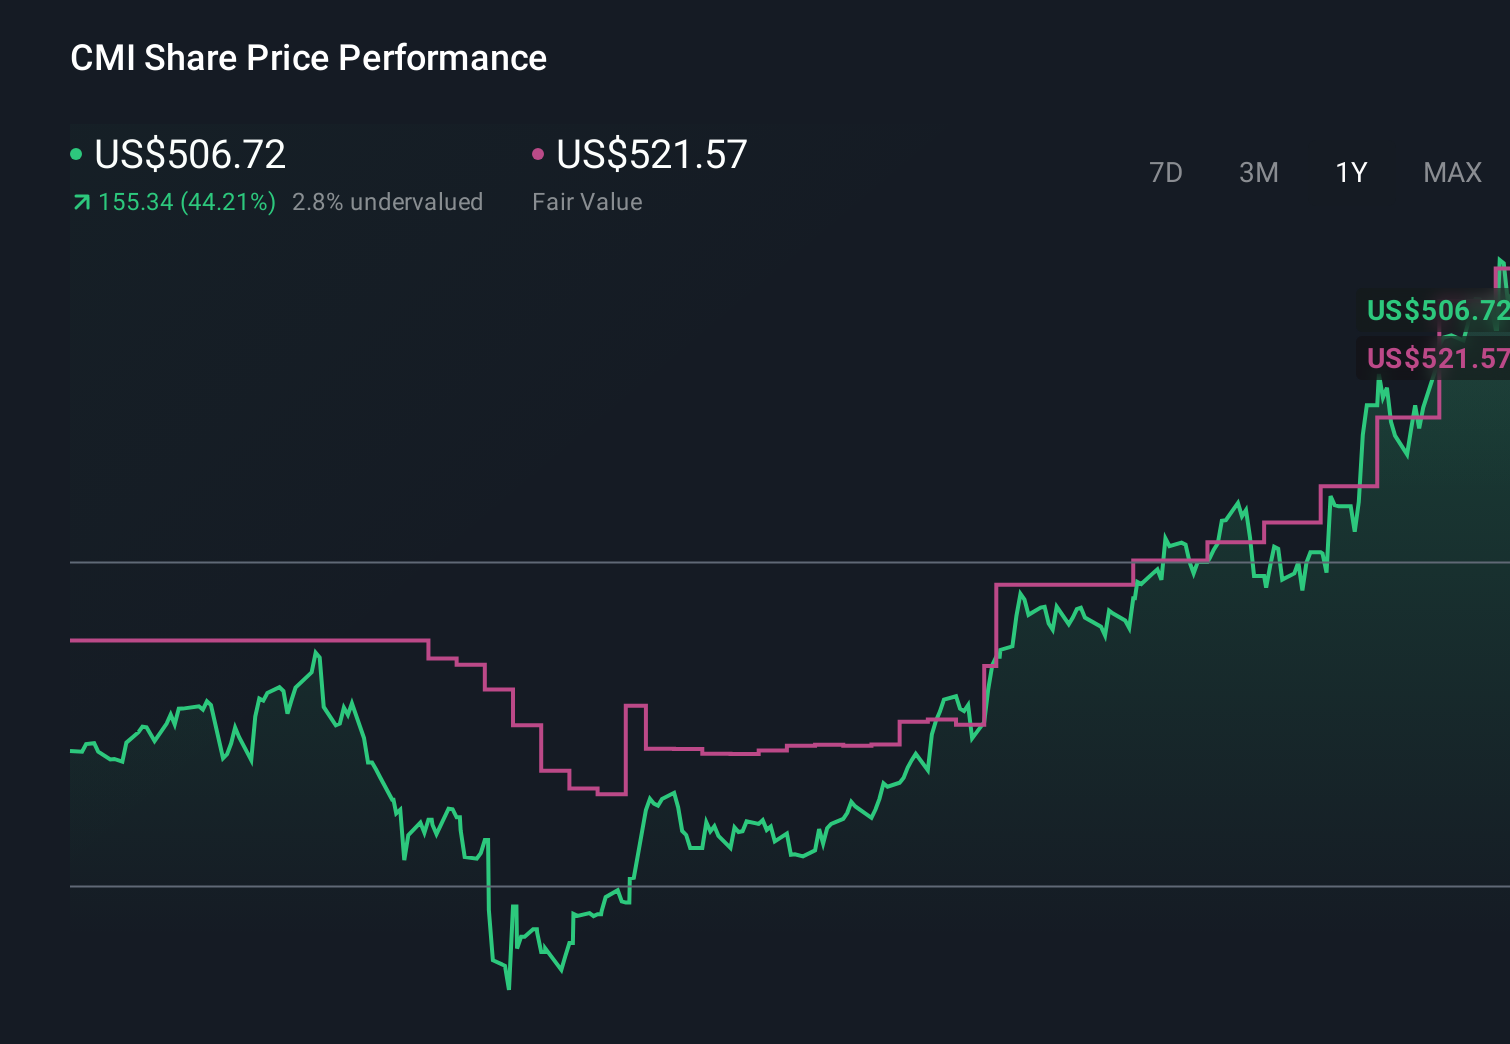
- The stock is not far from its recent level of US$540.65, after a 7.4% decline over the last week and a 1.1% decline over the last month, but gains of 3.6% year to date and 49.4% over the last year, with a 135.9% return over three years and 151.0% over five years.
- Those moves have come alongside continued attention on Cummins' role in capital goods and power solutions, as investors weigh how its positioning fits into long term industrial and energy trends. Even without a single headline event driving the latest pullback, the recent performance gives useful context for thinking about what the current price might be baking in.
- On our checklist of 6 valuation tests, Cummins scores 3, as shown by its 3 out of 6 valuation score. We will look at how different methods, such as multiples and discounted cash flow, line up with that view and then finish with a broader way to think about valuation that many investors overlook.
Approach 1: Cummins Discounted Cash Flow (DCF) Analysis
A Discounted Cash Flow, or DCF, model estimates what a business could be worth by projecting its future cash flows and then discounting those back to today using a required return.
For Cummins, the model used is a 2 Stage Free Cash Flow to Equity approach, built on cash flow projections in US$. The latest twelve month free cash flow is about $2.32b. Analysts provide explicit forecasts for the next few years, and Simply Wall St then extrapolates further to build a ten year path, with projected free cash flow of around $6.13b by 2035.
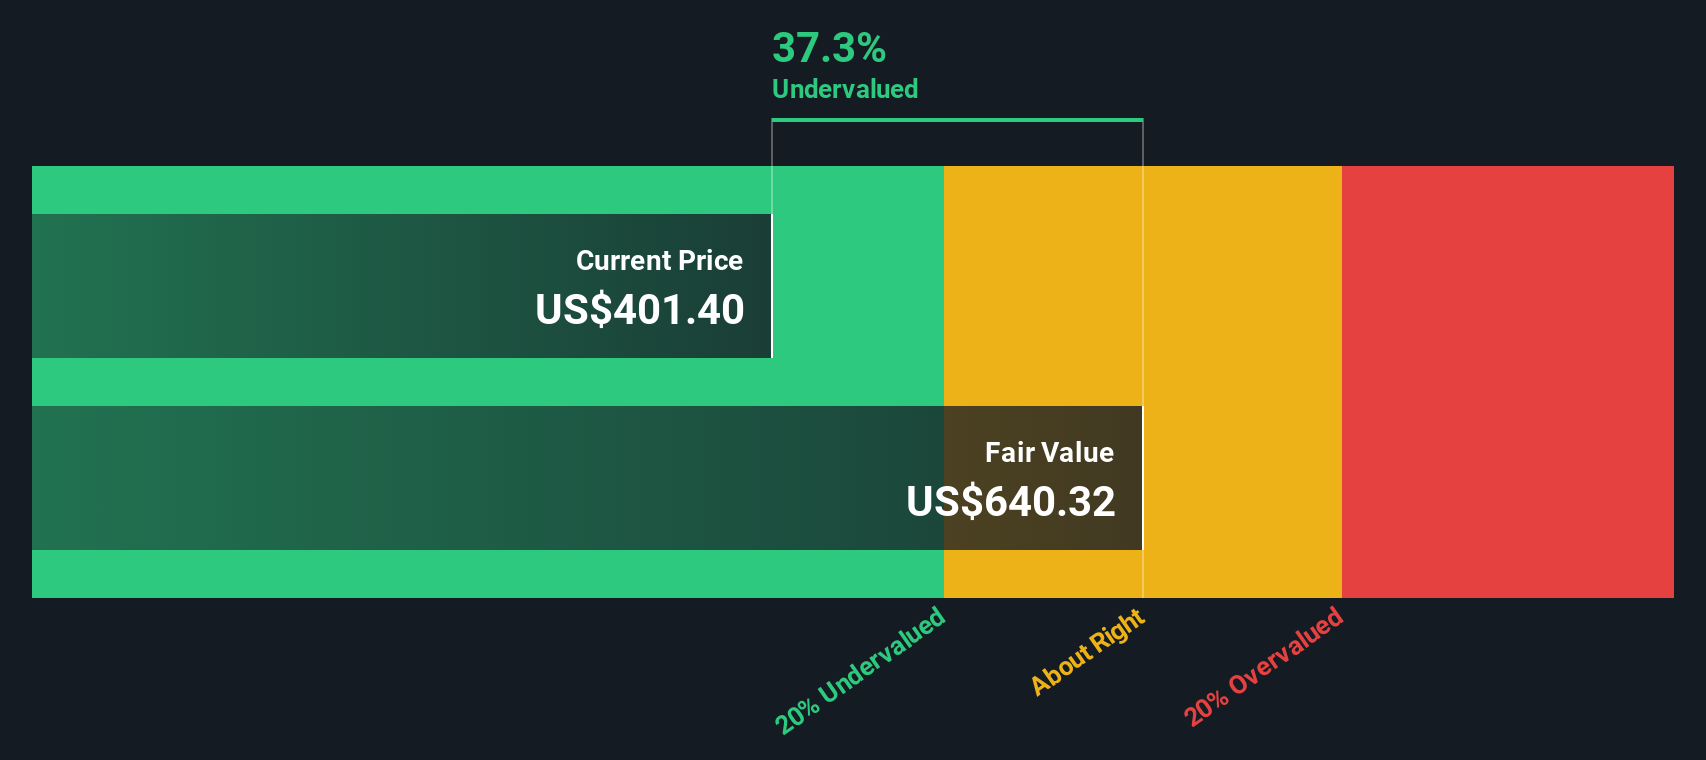
When all those projected cash flows are discounted back to today, the DCF model points to an estimated intrinsic value of about $621.83 per share. Compared with the recent share price around $540, this implies the stock trades at roughly a 13.1% discount to that DCF estimate. On this cash flow basis, the model indicates that Cummins is undervalued.
Result: UNDERVALUED
Our Discounted Cash Flow (DCF) analysis suggests Cummins is undervalued by 13.1%. Track this in your watchlist or portfolio, or discover 55 more high quality undervalued stocks.
Approach 2: Cummins Price vs Earnings
For a profitable company like Cummins, the P/E ratio is a useful anchor because it links what you pay directly to the earnings the business is currently generating. Investors typically accept a higher or lower P/E depending on what they expect for future earnings growth and how risky they perceive those earnings to be.
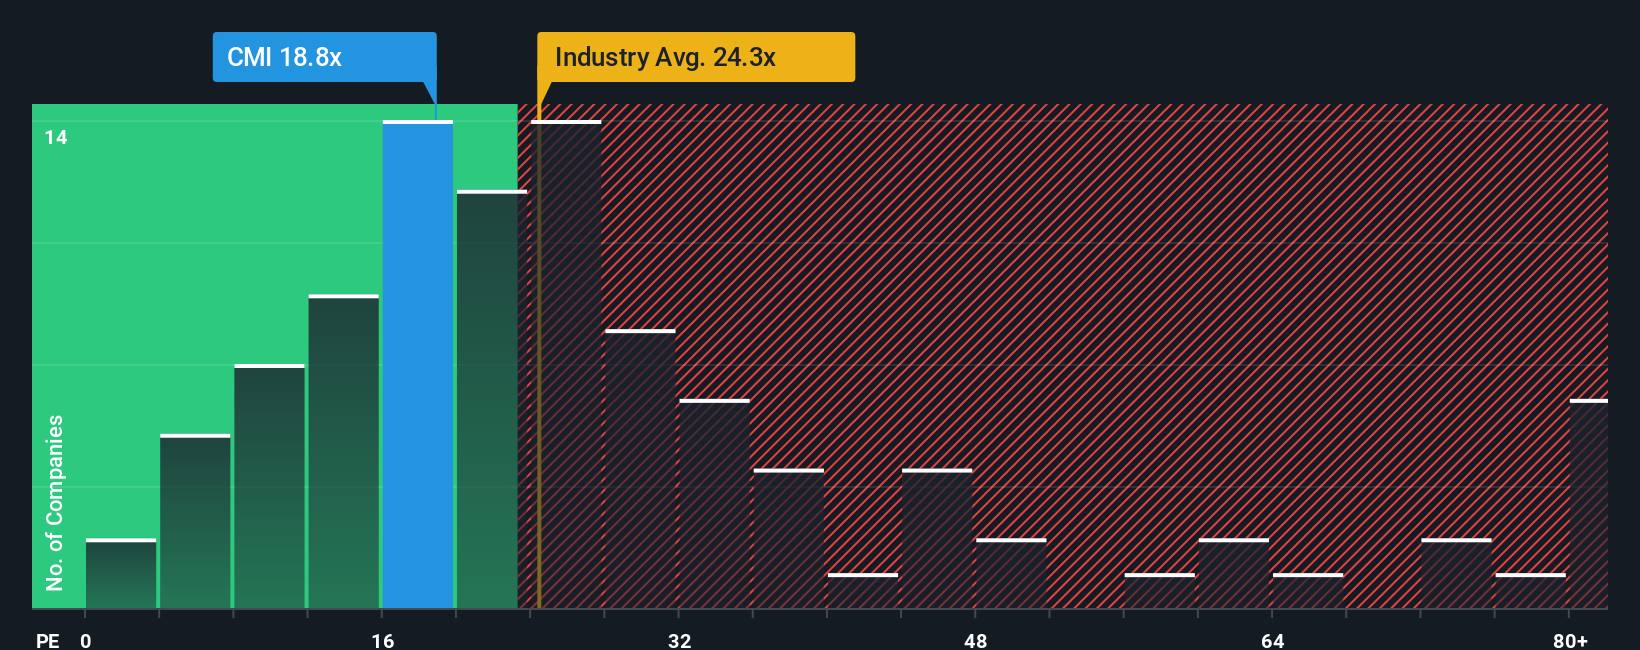
Cummins currently trades on a P/E of 27.97x. That sits close to both the Machinery industry average P/E of 27.89x and the peer group average of 28.70x, so on simple comparisons the market is valuing its earnings in line with sector norms. To go a step further, Simply Wall St uses a proprietary “Fair Ratio” framework, which estimates what P/E might make sense given factors such as earnings growth profile, profit margins, industry, market cap and company specific risks.
For Cummins, this Fair Ratio is 39.39x, which is significantly higher than the current 27.97x P/E. Because the Fair Ratio is tailored to the company rather than a broad peer set, it can offer a more nuanced view than standard industry or peer averages. On this basis, Cummins appears to be trading below the level implied by its Fair Ratio.
Result: UNDERVALUED
P/E ratios tell one story, but what if the real opportunity lies elsewhere? Start investing in legacies, not executives. Discover our 22 top founder-led companies.
Upgrade Your Decision Making: Choose your Cummins Narrative
Earlier we mentioned that there is an even better way to understand valuation, so let us introduce you to Narratives, a simple way to connect your view of Cummins with the numbers behind it.
A Narrative is your story for a company, where you spell out what you think happens to revenue, earnings and margins, and then link that to an estimated fair value rather than just relying on a single ratio or model.
On Simply Wall St, inside the Community page used by millions of investors, Narratives let you plug your assumptions into a forecast, compare the resulting fair value to the current share price, and decide whether you see Cummins as appealing or less appealing at today’s level.
Because Narratives update automatically when new earnings, news or other data arrive, your story and fair value view stay current without you having to rebuild a spreadsheet every time.
For example, one Cummins Narrative on the platform might assume a higher fair value and stronger long term margins. Another might use more cautious margin and revenue assumptions and land on a much lower fair value. This gives you a clear sense of how different perspectives can coexist around the same stock.
Do you think there's more to the story for Cummins? Head over to our Community to see what others are saying!
This article by Simply Wall St is general in nature. We provide commentary based on historical data and analyst forecasts only using an unbiased methodology and our articles are not intended to be financial advice. It does not constitute a recommendation to buy or sell any stock, and does not take account of your objectives, or your financial situation. We aim to bring you long-term focused analysis driven by fundamental data. Note that our analysis may not factor in the latest price-sensitive company announcements or qualitative material. Simply Wall St has no position in any stocks mentioned.