Is It Too Late To Consider DICK'S Sporting Goods (DKS) After Its Strong Multi Year Run
Dick's Sporting Goods, Inc. DKS | 0.00 |
- Wondering whether DICK'S Sporting Goods is still worth a spot on your watchlist after its recent run, or if the current share price is already baking in most of the upside?
- The stock last closed at US$215.49, with a 7 day return of a 4.8% decline, a 30 day return of 12.4%, year to date return of 7.6%, 1 year return of 18.4%, 3 year return of 64.4% and 5 year return of 186.4%.
- Recent attention on the company has centered on its position in the US retail sector and how investors are reacting to changing expectations around consumer spending. This context helps explain why the share price has been active over shorter periods while still showing strong multi year returns.
- Simply Wall St currently gives DICK'S Sporting Goods a valuation score of 1 out of 6. It is therefore worth looking at what traditional models say about fair value and then considering a more holistic way to think about valuation that will be covered later in this article.
DICK'S Sporting Goods scores just 1/6 on our valuation checks. See what other red flags we found in the full valuation breakdown.
Approach 1: DICK'S Sporting Goods Discounted Cash Flow (DCF) Analysis
A Discounted Cash Flow, or DCF, model projects a company’s future cash flows and then discounts those back to today’s dollars to estimate what the business might be worth right now.
For DICK'S Sporting Goods, the latest reported free cash flow is about $541.6 million. Analysts have provided several years of explicit forecasts, and Simply Wall St extends these further, with projected free cash flow of $368 million in 2029 and additional estimates out to 2035. All of these projected cash flows, expressed in dollars, are discounted using a 2 Stage Free Cash Flow to Equity model to arrive at a per share estimate.
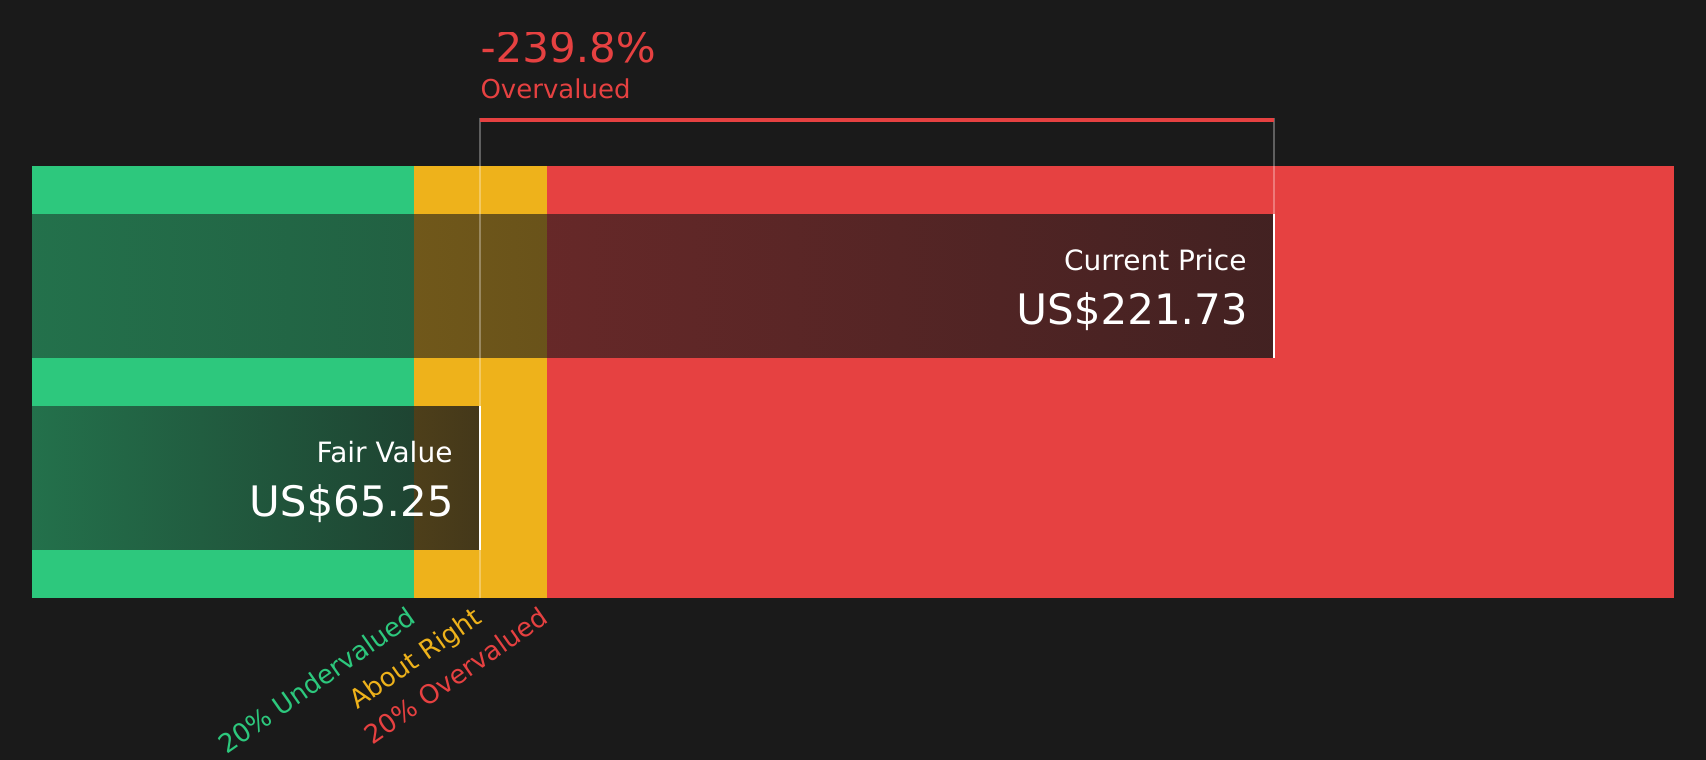
On this basis, the DCF model suggests an intrinsic value of about $61.75 per share, compared with the recent share price of $215.49. That implies the stock is viewed as very expensive relative to this cash-flow-based estimate, with the DCF pointing to roughly a 249% overvaluation.
Result: OVERVALUED
Our Discounted Cash Flow (DCF) analysis suggests DICK'S Sporting Goods may be overvalued by 249.0%. Discover 51 high quality undervalued stocks or create your own screener to find better value opportunities.
Approach 2: DICK'S Sporting Goods Price vs Earnings
For a profitable company, the P/E ratio is a useful cross check because it links what you pay for each share directly to the earnings that support that share price. It also captures how the market weighs factors like future growth, business stability and risk. Higher growth and lower perceived risk usually come with a higher P/E, while slower growth or higher risk tend to justify a lower one.
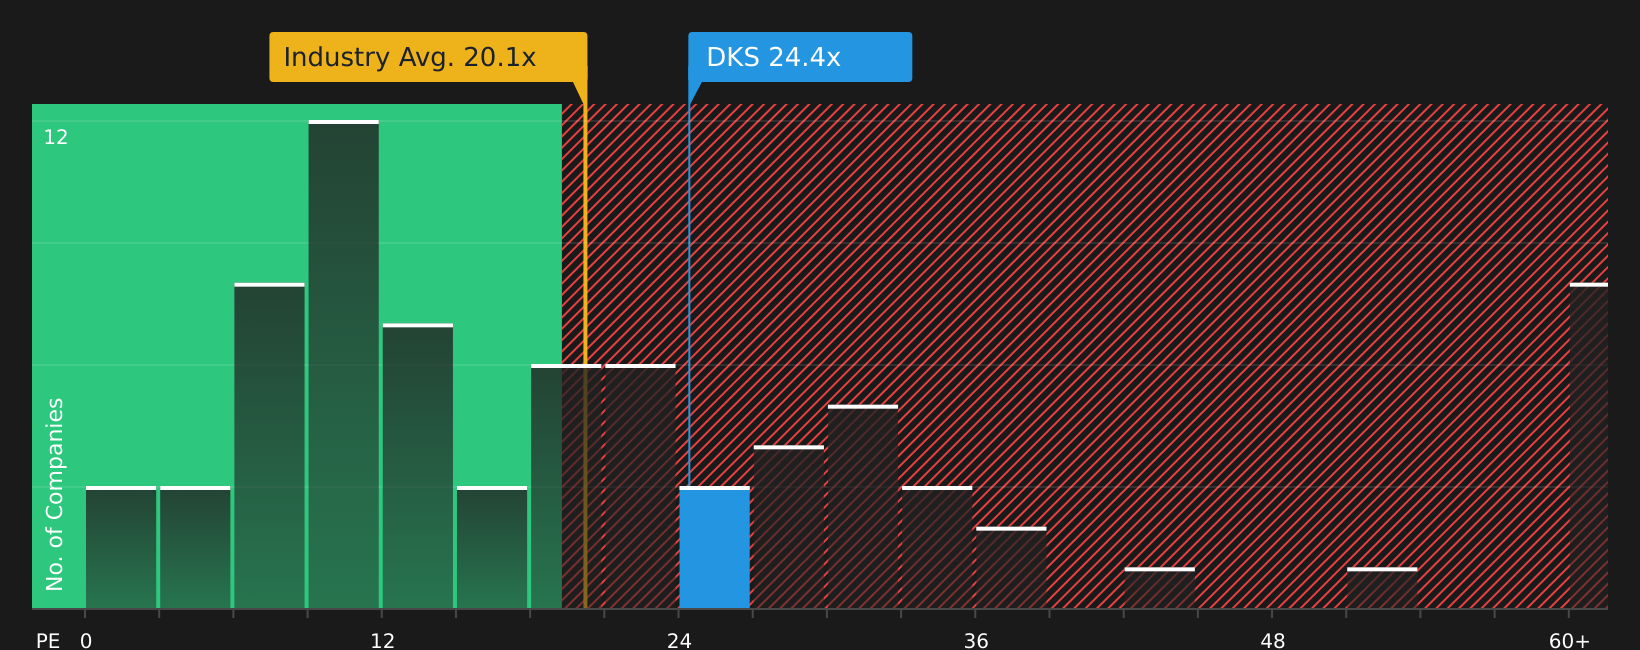
DICK'S Sporting Goods currently trades on a P/E of 22.59x. This sits above the Specialty Retail industry average of about 19.80x, but below the peer group average of 29.21x. Simply Wall St also calculates a proprietary “Fair Ratio” of 21.35x for the stock, which is the P/E level suggested by its earnings profile, industry, profit margin, market cap and risk factors.
The Fair Ratio can be more informative than a simple comparison with peers or the industry because it adjusts for company specific traits rather than assuming all retailers deserve the same multiple. Compared with the actual P/E of 22.59x, the Fair Ratio of 21.35x points to the stock being somewhat expensive relative to this earnings based yardstick.
Result: OVERVALUED
P/E ratios tell one story, but what if the real opportunity lies elsewhere? Start investing in legacies, not executives. Discover our 19 top founder-led companies.
Upgrade Your Decision Making: Choose your DICK'S Sporting Goods Narrative
Earlier it was mentioned that there is an even better way to understand valuation. Narratives on Simply Wall St let you attach your own story about DICK'S Sporting Goods to the numbers by linking a clear view of its business, a forecast for revenue, earnings and margins, and an implied fair value. This view is then continuously updated as new news or earnings arrive, so you can easily compare fair value to the current price and decide whether the stock still fits your plan, whether you lean toward a higher fair value like about US$300 or a lower one around US$172.69, with both viewpoints already visible and editable on the Community page used by millions of investors.
For DICK'S Sporting Goods, however, we will make it really easy for you with previews of two leading DICK'S Sporting Goods Narratives:
Start with the bullish view if you think the stock deserves a higher valuation multiple and can keep building on its current position, or focus on the bear case if you are more cautious about execution risks and capital spending.
Fair value in this bullish narrative: US$300.00 per share.
Implied upside vs last close of US$215.49: about 28%.
Revenue growth assumption: 13.08% a year.
- View that omni channel execution, experiential formats and digital platforms like GameChanger and the DICK'S Media Network support higher revenue, margins and market share over time.
- Analyst assumptions include revenue of US$24.9b and earnings of US$1.8b by 2029, with a P/E of 24.3x applied to those earnings and a 9.29% discount rate.
- Key risks include dependence on major brands and physical stores, higher capital spending on new formats and industry wide cost and competition pressures that could weigh on margins.
Fair value in this bearish narrative: US$172.69 per share.
Implied downside vs last close of US$215.49: about 20%.
Revenue growth assumption: 10.54% a year.
- Concern that heavy spending on House of Sport expansion, marketing, technology and inventory could weigh on margins and cash flows if sales do not keep pace.
- Analyst assumptions include revenue of US$23.3b and earnings of US$1.3b by 2029, with a P/E of 19.1x on those earnings and a 9.2% discount rate.
- Upside risks to this cautious view include solid recent sales, growth in footwear and benefits from GameChanger, DICK'S Media Network and omni channel investments.
Both narratives sit on the same set of disclosed numbers, but they lean on different views about how much earnings power DICK'S Sporting Goods can create from its store footprint, digital platforms and capital program, and what P/E multiple that should attract.
If you want to see the full detail behind each set of assumptions and decide which story fits your own expectations, you can review the full range of community views and valuation work that sit behind these summaries, including how they respond when new earnings or news are released, in the narrative section on Simply Wall St, where you will also find tools to track the stock alongside others in your portfolio.
To see how these results tie into long-term growth, risks, and valuation, check out the full range of community narratives for DICK'S Sporting Goods on Simply Wall St. Add the company to your watchlist or portfolio so you'll be alerted when the story evolves.
Do you think there's more to the story for DICK'S Sporting Goods? Head over to our Community to see what others are saying!

This article by Simply Wall St is general in nature. We provide commentary based on historical data and analyst forecasts only using an unbiased methodology and our articles are not intended to be financial advice. It does not constitute a recommendation to buy or sell any stock, and does not take account of your objectives, or your financial situation. We aim to bring you long-term focused analysis driven by fundamental data. Note that our analysis may not factor in the latest price-sensitive company announcements or qualitative material. Simply Wall St has no position in any stocks mentioned.