Is It Too Late To Consider Dycom Industries (DY) After Its Strong Multi Year Rally
Dycom Industries, Inc. DY | 348.15 | +0.20% |
- If you are wondering whether Dycom Industries is still fairly priced after a strong run, this article walks through what the current market price might be implying about its value.
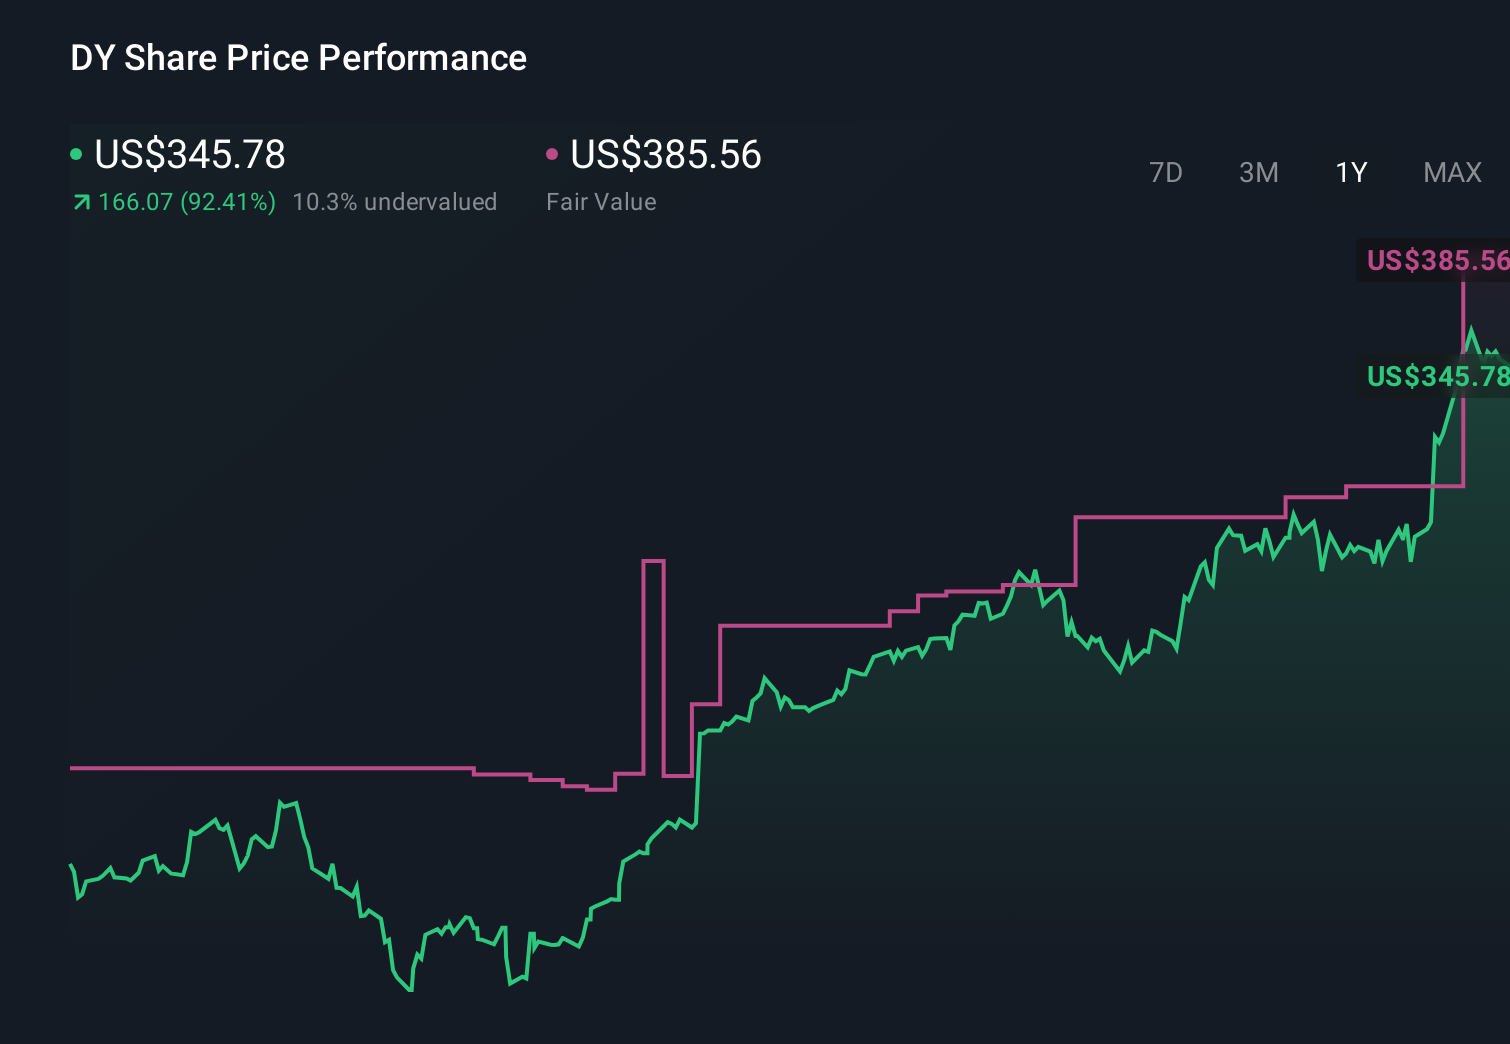
- At a last close of US$427.48, the stock has posted returns of 6.7% over the past week, 15.3% over the past month, 23.0% year to date and 139.9% over the past year, with around a 4x return over three years and just over a 4.5x return over five years.
- Recent coverage has focused on Dycom Industries as part of ongoing interest in capital goods and infrastructure related names in the US market, where investors are paying closer attention to companies involved in large scale build outs. This context helps frame why the share price performance is drawing fresh interest from investors who are rechecking what they are paying for each dollar of cash flow and assets.
- Despite the strong price performance, Dycom Industries currently has a valuation score of 0 out of 6 on our checks. We will assess what common methods like discounted cash flow, multiples and peer comparisons suggest about the stock's value, then finish with a way of looking at valuation that can give you a fuller picture than any single model on its own.
Dycom Industries scores just 0/6 on our valuation checks. See what other red flags we found in the full valuation breakdown.
Approach 1: Dycom Industries Discounted Cash Flow (DCF) Analysis
A Discounted Cash Flow model projects the cash a company might generate in the future, then discounts those projections back to what they could be worth in today’s dollars. It is essentially asking what a stream of future cash flows is worth now.
For Dycom Industries, the model used is a 2 Stage Free Cash Flow to Equity approach. The latest twelve month Free Cash Flow is about $283.4 million. Analysts provide detailed estimates out to 2028, with projected Free Cash Flow of $515.8 million in that year. Beyond the analyst horizon, Simply Wall St extrapolates cash flows out to 2035, with annual figures remaining in the hundreds of millions of dollars, all in US$.
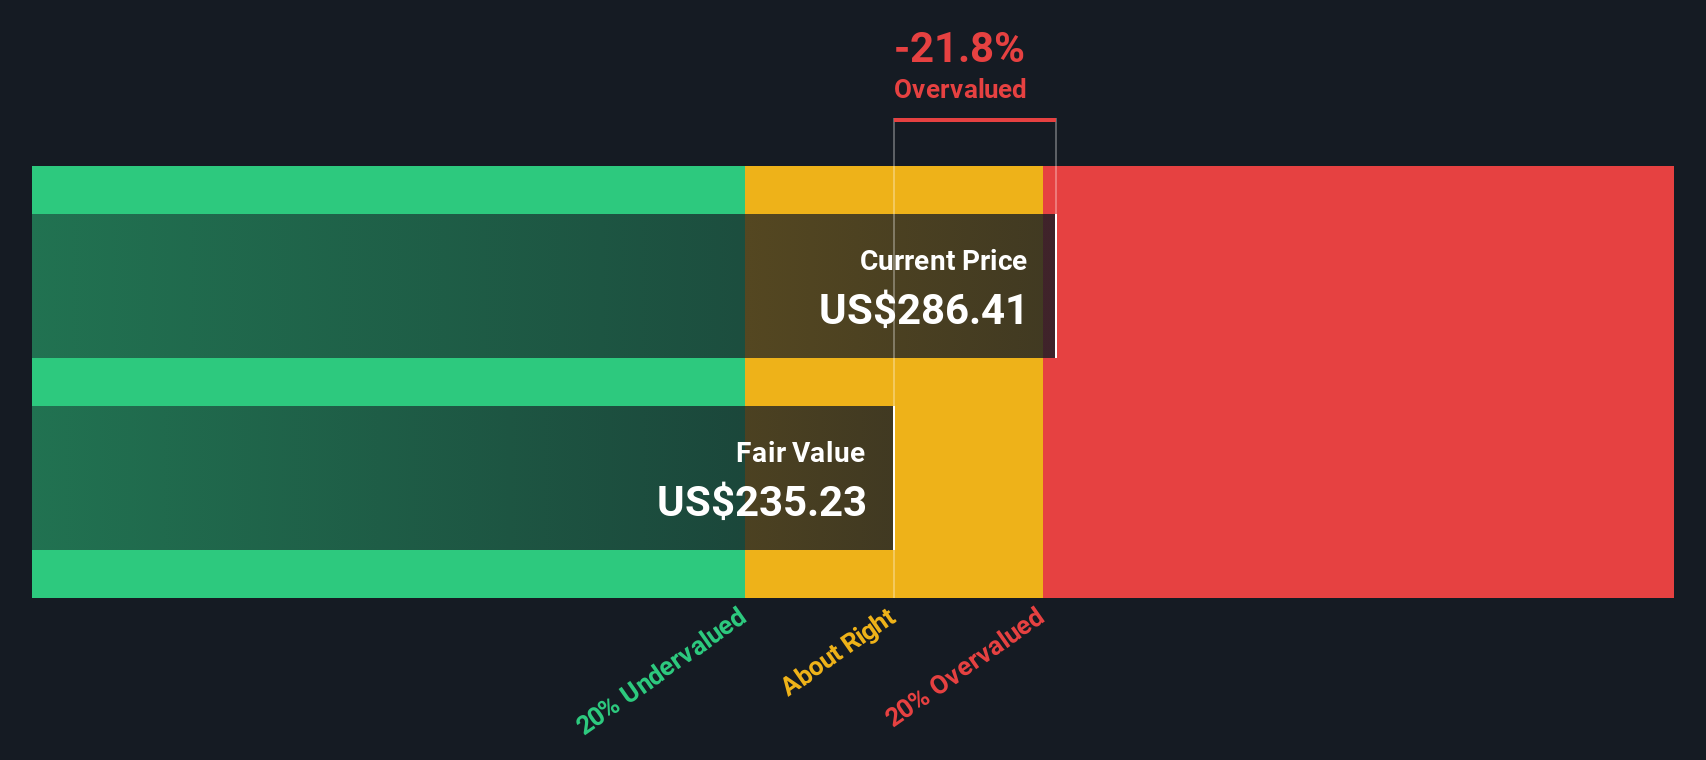
When those projected cash flows are discounted back using this model, the estimated intrinsic value comes out at about $423.57 per share. Against the recent share price of $427.48, the model implies Dycom Industries is around 0.9% overvalued, which is effectively a tight range around the current market price.
Result: ABOUT RIGHT
Dycom Industries is fairly valued according to our Discounted Cash Flow (DCF), but this can change at a moment's notice. Track the value in your watchlist or portfolio and be alerted on when to act.
Approach 2: Dycom Industries Price vs Earnings
For a profitable company like Dycom Industries, the P/E ratio is a useful way to gauge what you are paying for each dollar of current earnings. Investors typically accept a higher P/E when they expect stronger growth or see lower risk, and a lower P/E when they expect slower growth or view the earnings stream as more uncertain.
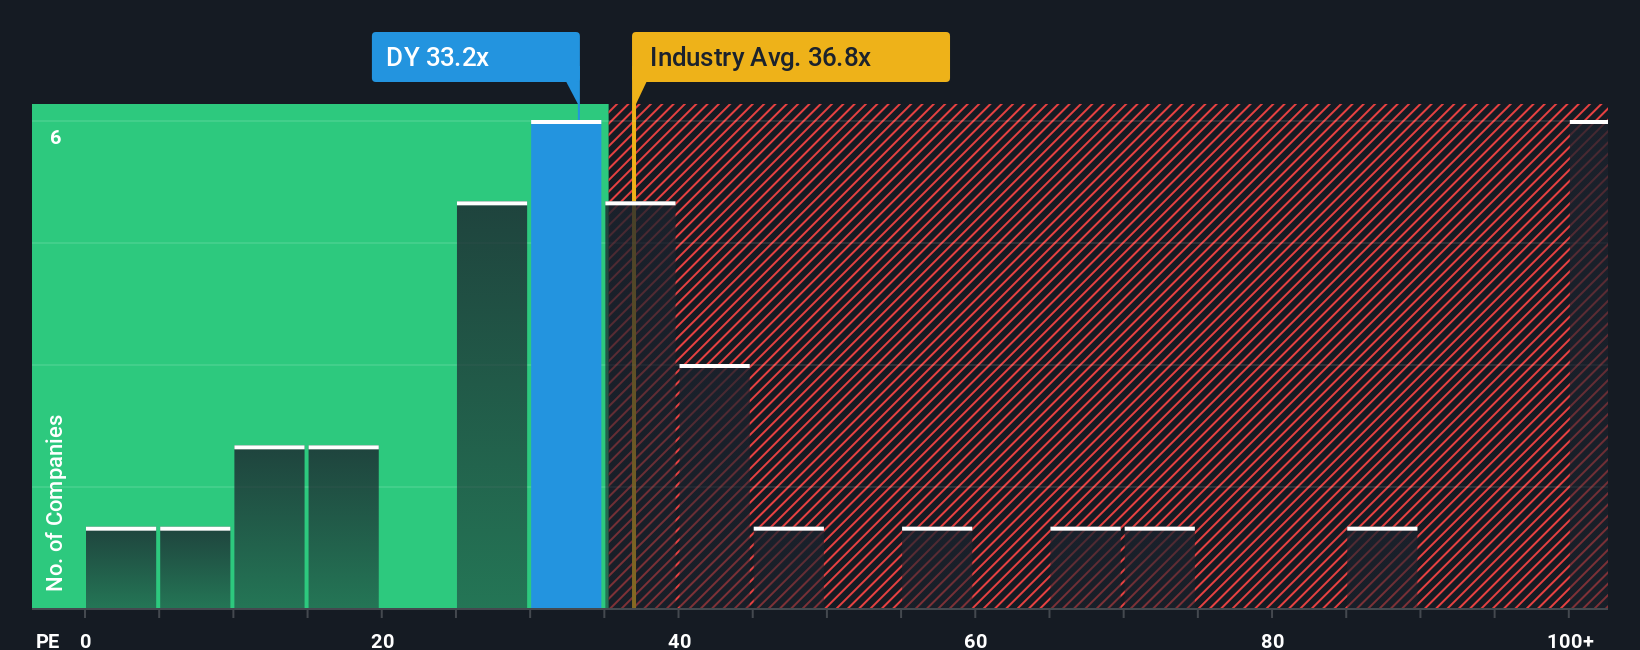
Dycom Industries currently trades on a P/E of 43.05x. That sits above the Construction industry average of 38.34x and also above the peer group average of 31.13x. On the surface, that suggests the market is putting a relatively higher value on the company’s earnings than on many of its listed peers.
Simply Wall St’s Fair Ratio for Dycom Industries is 32.89x. This is a proprietary estimate of what a reasonable P/E might be given factors such as the company’s earnings growth profile, profit margins, industry, market cap and risk characteristics. Because it adjusts for these fundamentals, the Fair Ratio can give you a more tailored reference point than a simple comparison with sector or peer averages. Set against the current P/E of 43.05x, the Fair Ratio points to the shares trading at a richer level than this model would suggest.
Result: OVERVALUED
P/E ratios tell one story, but what if the real opportunity lies elsewhere? Start investing in legacies, not executives. Discover our 23 top founder-led companies.
Upgrade Your Decision Making: Choose your Dycom Industries Narrative
Earlier we mentioned that there is an even better way to understand valuation. On Simply Wall St’s Community page you can use Narratives, where you and other investors link a clear story about Dycom Industries to specific forecasts for revenue, earnings and margins, translate that into a Fair Value, compare it with the current price to help decide whether to buy or sell, and see that view update automatically when new guidance or news arrives. For example, one investor might build a bullish Dycom narrative around accelerating fiber and data connectivity, contract backlog and a Fair Value of about US$407.82. Another might focus more on customer concentration, regulatory delays and technology shifts and arrive at a lower Fair Value using different assumptions.
Do you think there's more to the story for Dycom Industries? Head over to our Community to see what others are saying!
This article by Simply Wall St is general in nature. We provide commentary based on historical data and analyst forecasts only using an unbiased methodology and our articles are not intended to be financial advice. It does not constitute a recommendation to buy or sell any stock, and does not take account of your objectives, or your financial situation. We aim to bring you long-term focused analysis driven by fundamental data. Note that our analysis may not factor in the latest price-sensitive company announcements or qualitative material. Simply Wall St has no position in any stocks mentioned.