

Is It Too Late To Consider EchoStar (SATS) After Its Multi Year Share Price Surge
Echostar SATS | 0.00 |
- Wondering whether EchoStar's share price still reflects fair value after a huge run, or if you are arriving late? This article walks through what the numbers say about the stock today.
- EchoStar shares closed at US$123.12, with the price falling 9.8% over the last week, rising 4.8% over the last month and 9.8% year to date, while the 1 year return is very large and the 3 year return is more than 7x.
- Recent coverage has focused on EchoStar's sharp multi year share price gains and how that reshapes expectations around what might be priced in. Other commentary has highlighted how investors are reassessing risk and growth assumptions after such a rapid rerating.
- Even after this kind of performance, EchoStar has a valuation score of 1 out of 6. The next sections will compare different valuation methods on the stock and then finish with a framework that can help you understand EchoStar's value in a broader way.
EchoStar scores just 1/6 on our valuation checks. See what other red flags we found in the full valuation breakdown.
Approach 1: EchoStar Discounted Cash Flow (DCF) Analysis
A Discounted Cash Flow, or DCF, model estimates what a stock could be worth today by projecting the company’s future cash flows and discounting them back to a single present value figure.
For EchoStar, the model uses a 2 Stage Free Cash Flow to Equity approach based on cash flow projections in $. The latest twelve month free cash flow is a loss of $2.45b, so the model relies heavily on expected improvements in future free cash flow. Analyst inputs and extensions by Simply Wall St include projected free cash flow of $184.03m in 2026 and $1.91b in 2030, with values between those years stepping up as shown in the ten year projection table.
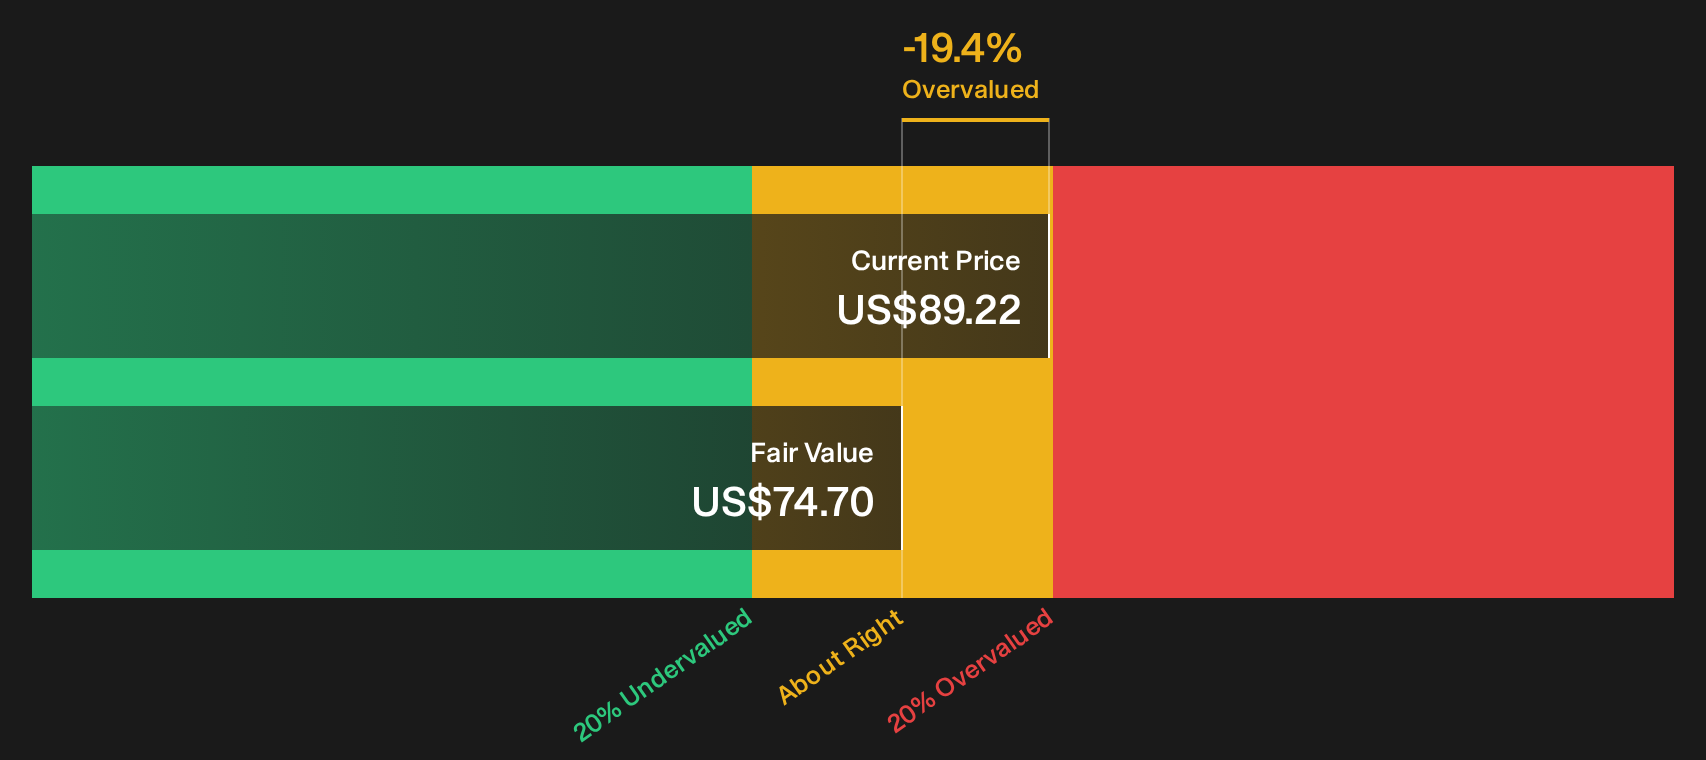
Discounting those projected cash flows back to today produces an estimated intrinsic value of $115.78 per share. Compared with the recent share price of $123.12, the DCF suggests EchoStar is about 6.3% above this estimate, which points to the stock being roughly in line with the model’s assessment rather than clearly cheap or expensive.
Result: ABOUT RIGHT
EchoStar is fairly valued according to our Discounted Cash Flow (DCF), but this can change at a moment's notice. Track the value in your watchlist or portfolio and be alerted on when to act.
Approach 2: EchoStar Price vs Sales
For companies where earnings are limited or volatile, revenue can be a more stable anchor for valuation. This is why the P/S ratio is a useful metric. It compares what investors are paying for each dollar of sales, and the level that looks reasonable usually reflects expectations for future growth and the risk investors see in those sales.
EchoStar trades on a P/S of 2.41x. That sits below the peer average of 3.18x but above the wider Media industry average of 1.10x. This indicates the stock is priced at a premium to the sector overall but at a discount to closer peers. Simply Wall St’s Fair Ratio for EchoStar is 1.30x, which is the P/S level it estimates based on factors such as the company’s earnings growth profile, industry, profit margins, market cap and assessed risks.
The Fair Ratio approach goes beyond simple peer or industry comparisons because it adjusts for company specific characteristics rather than assuming all Media stocks should trade on similar multiples. Comparing EchoStar’s actual P/S of 2.41x with the Fair Ratio of 1.30x suggests the shares are trading above this tailored assessment.
Result: OVERVALUED

P/S ratios tell one story, but what if the real opportunity lies elsewhere? Start investing in legacies, not executives. Discover our 20 top founder-led companies.
Upgrade Your Decision Making: Choose your EchoStar Narrative
Earlier it was mentioned that there is an even better way to understand valuation, so Narratives are introduced here as a simple way for you to attach a clear story about EchoStar to your numbers like fair value, future revenue, earnings and margin estimates, then see how that story translates into a valuation that you can compare with the current share price.
On Simply Wall St, Narratives live inside the Community page and allow you to select or build a view that ties EchoStar’s business story into a full forecast. This way, you can quickly see whether that story points to a fair value above or below today’s price and decide whether that makes EchoStar look more like a potential opportunity or a stock to be cautious about.
Because Narratives update automatically when new information is added, such as EchoStar’s earnings releases, index changes or buyback updates, your chosen fair value stays aligned with the latest data without you having to rebuild a model from scratch each time something changes.
For EchoStar, one investor might align with the higher community fair value around US$147.00, another might lean toward the more cautious US$120.00 view. Narratives let you see exactly which revenue, margin and P/E assumptions sit behind each stance so you can decide which story, if either, fits your own expectations.
For EchoStar however, we will make it really easy for you with previews of two leading EchoStar Narratives:
Taken together, they show how different assumptions on revenue, margins, balance sheet risk and satellite exposure can point to very different views of fair value. Your job is to decide which story feels closer to how you see the business.
Fair value in this narrative: US$134.80 per share
Implied valuation gap versus the latest close: the price is about 8.7% below this narrative fair value, so it treats EchoStar as undervalued on these assumptions.
Revenue trend used in this story: revenue is assumed to decline 3.50% a year for the next 3 years.
- Focuses on EchoStar’s wideband LEO direct to device satellite project and spectrum assets as key drivers of future wholesale connectivity revenue to carriers, enterprises and governments.
- Builds in a shift from very weak current margins to a 9.8% profit margin and earnings of US$1.3b by around 2029, with a future P/E of 38.6x underpinning a fair value of US$134.80.
- Flags meaningful risks around FCC spectrum decisions, shrinking legacy Pay TV and broadband businesses, high debt and funding needs for the LEO build, and intense competition from players such as SpaceX and Amazon.
Fair value in this narrative: US$43.91 per share
Implied valuation gap versus the latest close: the price is about 180.4% above this narrative fair value, so it treats EchoStar as heavily overvalued on these assumptions.
Revenue trend used in this story: revenue is assumed to decline 2.30% a year.
- Views EchoStar mainly through the lens of exposure to SpaceX and Starlink, arguing that the stock already bakes in a very optimistic outcome for any eventual SpaceX valuation and for EchoStar’s indirect stake.
- Treats EchoStar less as an operating telecom and more as a holding vehicle for space assets, and applies a large holding company type discount to arrive at a much lower fair value of US$43.91.
- Highlights that the market may be focusing on the appeal of the broader space ecosystem and S&P 500 inclusion while paying less attention to EchoStar’s own historic cash burn and execution risks.
If you want to move beyond these two previews and see the full range of views on revenue, margins, P/E and fair value that other investors are using for EchoStar, See what the community is saying about EchoStar.
Do you think there's more to the story for EchoStar? Head over to our Community to see what others are saying!

This article by Simply Wall St is general in nature. We provide commentary based on historical data and analyst forecasts only using an unbiased methodology and our articles are not intended to be financial advice. It does not constitute a recommendation to buy or sell any stock, and does not take account of your objectives, or your financial situation. We aim to bring you long-term focused analysis driven by fundamental data. Note that our analysis may not factor in the latest price-sensitive company announcements or qualitative material. Simply Wall St has no position in any stocks mentioned.