Is It Too Late To Consider FedEx (FDX) After A 93% One Year Rally?
Fedex FDX | 0.00 |
- If you are wondering whether FedEx at around US$411.75 is still offering value after a strong run, the key is to look closely at what the current price implies about the company.
- The stock has posted returns of 4.5% over the past week, 4.6% over the past month, 40.5% year to date and 93.2% over the past year, which naturally raises questions about growth potential and how much risk is already priced in.
- Recent coverage has focused on FedEx as a major global logistics player, with attention on parcel volumes, cost efficiency efforts and how the company is positioned in e commerce and business shipping trends. This backdrop helps frame why the share price has been so responsive to any updates about demand, margins or capital allocation.
- FedEx currently has a valuation score of 4/6. The stock screens as undervalued on several checks, and the next sections will unpack how standard methods like P/E, multiples and cash flow models compare, before finishing with a more holistic way to think about what the market is really pricing in.
Approach 1: FedEx Discounted Cash Flow (DCF) Analysis
A Discounted Cash Flow model takes forecasts of a company’s future cash flows and discounts them back to today’s value, to estimate what the entire business could be worth right now.
For FedEx, the latest twelve months Free Cash Flow is about $3.6b. Analysts and internal estimates project Free Cash Flow building from this base, with a ten year path that reaches $15.6b by 2035. The 2 Stage Free Cash Flow to Equity model used here combines these annual projections with a discount rate to convert each future year into today’s dollars.
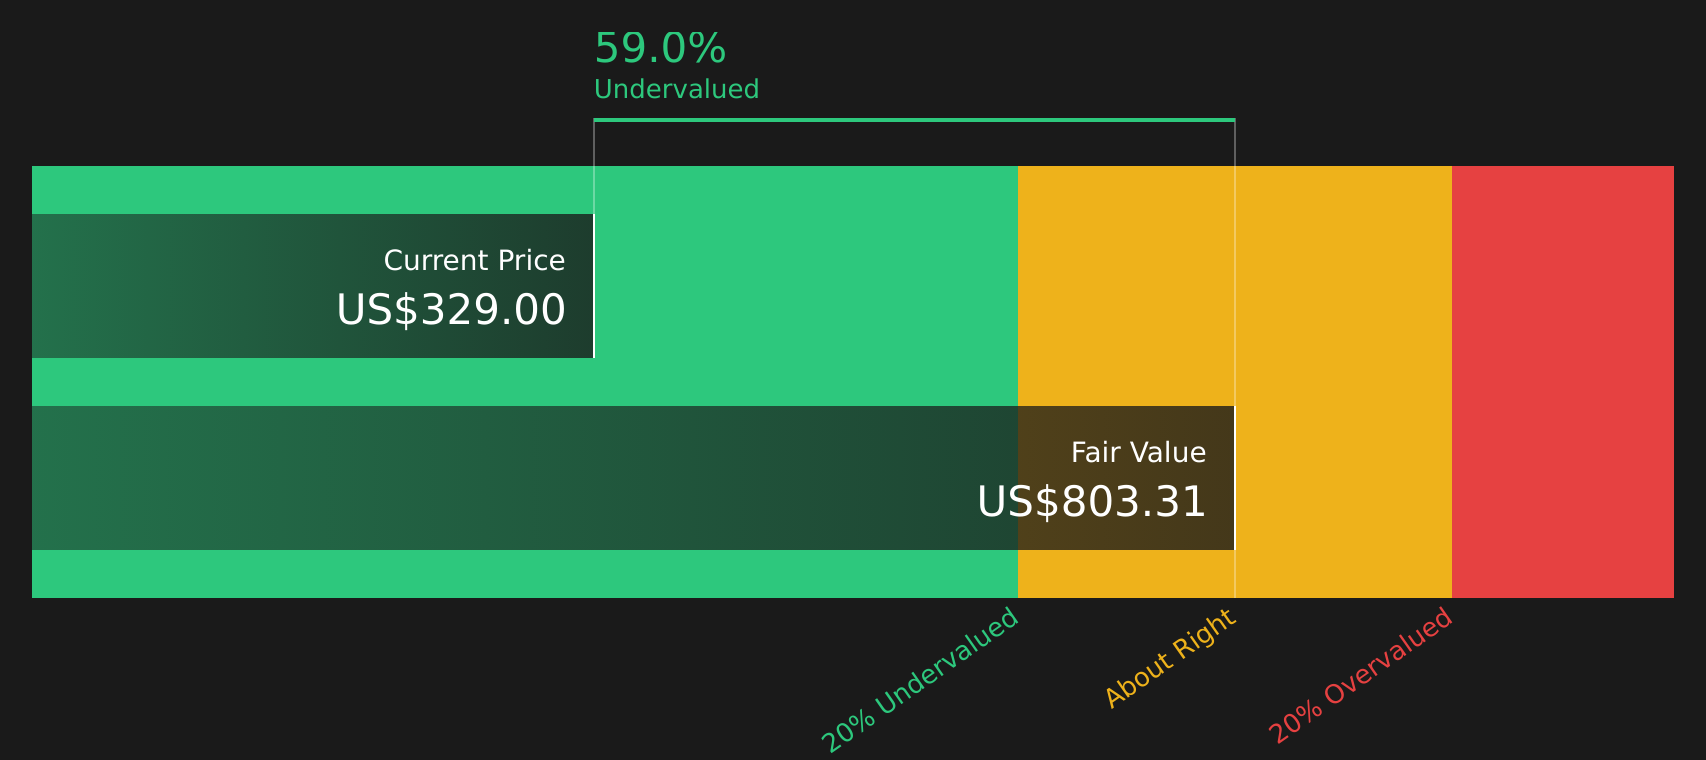
Adding those discounted cash flows together produces an estimated intrinsic value of about $822.59 per share, based on Simply Wall St’s cash flow projections. Compared with the current share price of roughly $411.75, this model suggests the stock trades at a 49.9% discount to this DCF estimate. On this approach, FedEx screens as materially undervalued.
Result: UNDERVALUED
Our Discounted Cash Flow (DCF) analysis suggests FedEx is undervalued by 49.9%. Track this in your watchlist or portfolio, or discover 46 more high quality undervalued stocks.
Approach 2: FedEx Price vs Earnings
For profitable companies, the P/E ratio is a useful way to see how much you are paying for each dollar of current earnings. This makes it a common starting point when you want a quick reality check on valuation.
What counts as a “normal” or “fair” P/E depends on how fast earnings are expected to grow and how risky those earnings are. Higher expected growth or lower perceived risk can justify a higher P/E, while slower growth or higher risk usually calls for a lower one.
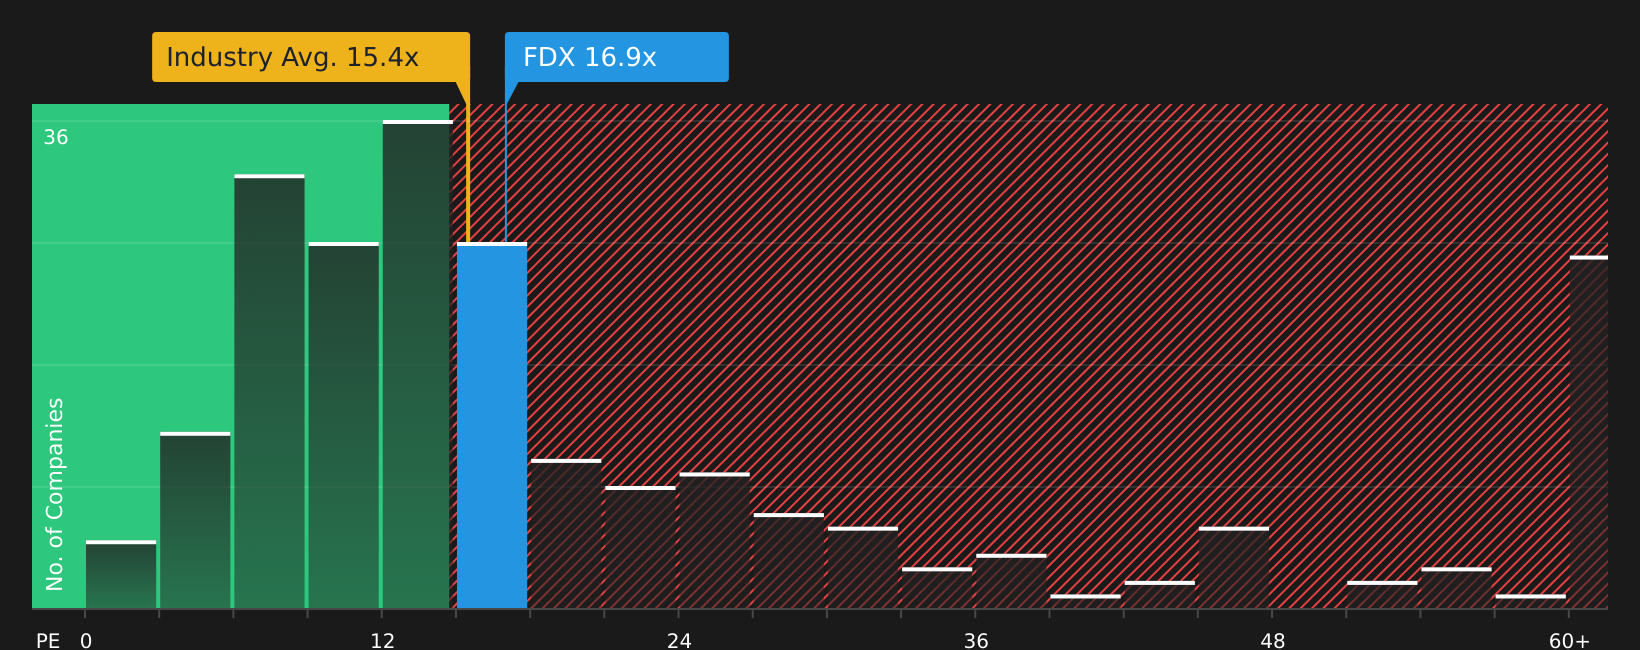
FedEx currently trades at a P/E of about 21.9x. That is above the Logistics industry average of 15.2x and roughly in line with the peer group average of 22.4x. Simply Wall St’s Fair Ratio for FedEx is 26.8x, which is a proprietary estimate of what the P/E might be given factors like earnings growth characteristics, industry, profit margins, market value and risk profile.
The Fair Ratio can be more informative than a simple peer or industry comparison because it tries to align the multiple with FedEx’s specific fundamentals rather than broad group averages. Since the Fair Ratio of 26.8x is higher than the current P/E of 21.9x, this approach points to the stock looking undervalued on earnings.
Result: UNDERVALUED
P/E ratios tell one story, but what if the real opportunity lies elsewhere? Start investing in legacies, not executives. Discover our 20 top founder-led companies.
Upgrade Your Decision Making: Choose your FedEx Narrative
Earlier it was mentioned that there is an even better way to understand valuation, so Narratives are introduced here as a simple tool that lets you attach a story about FedEx to specific numbers such as fair value, future revenue, earnings and margins.
A Narrative connects three things: your view of FedEx's business story, a financial forecast that reflects that view and a fair value that comes out of those assumptions.
On Simply Wall St's Community page, Narratives are set up so you can pick or create a story, see the forecast that goes with it and then compare the resulting Fair Value with the current share price to help you decide whether you see FedEx as priced above or below what you believe it is worth.
Because Narratives on the platform update when new information comes in, such as earnings, news or guidance changes, your story and fair value stay aligned with the latest data without you needing to rebuild a model each time.
For FedEx, one investor might lean toward a more optimistic Narrative that lines up with a Fair Value around US$479.00, while another might choose a more cautious Narrative closer to US$233.77. Seeing those side by side makes it clearer which story you agree with and how that compares to the current price.
For FedEx, we will make it really easy for you with previews of two leading FedEx Narratives:
Fair Value: US$479.00
Implied upside vs current price: about 14.1% below this fair value
Revenue growth used in this story: 6.0%
- Sees FedEx's DRIVE and Network 2.0 programs as powerful margin and earnings drivers if they are embedded as a permanent discipline rather than a one off cost effort.
- Leans on growing exposure to healthcare logistics, AI enabled tracking and global e commerce flows to support stronger revenue and pricing power.
- Accepts higher earnings and P/E assumptions than consensus, while still highlighting real risks around inflation, lower yielding services, trade rules and long term parcel demand.
Fair Value: US$401.89
Implied downside vs current price: about 2.4% above this fair value
Revenue growth used in this story: 4.6%
- Assumes FedEx's cost programs and network projects, including DRIVE and Network 2.0, support steady improvement but broadly line up with current expectations.
- Builds in more measured revenue and margin assumptions, with attention on contract changes, freight separation and pricing pressure in certain international and deferred services.
- Treats the stock as close to fairly priced on its earnings path, while still flagging that execution on restructuring, trade exposure and economic conditions could tilt the outcome either way.
If you want to see how other investors are framing the same facts into bullish or cautious stories, and how their fair values compare with today's price, To see how these results tie into long-term growth, risks, and valuation, check out the full range of community narratives for FedEx on Simply Wall St. Add the company to your watchlist or portfolio so you'll be alerted when the story evolves.
Do you think there's more to the story for FedEx? Head over to our Community to see what others are saying!

This article by Simply Wall St is general in nature. We provide commentary based on historical data and analyst forecasts only using an unbiased methodology and our articles are not intended to be financial advice. It does not constitute a recommendation to buy or sell any stock, and does not take account of your objectives, or your financial situation. We aim to bring you long-term focused analysis driven by fundamental data. Note that our analysis may not factor in the latest price-sensitive company announcements or qualitative material. Simply Wall St has no position in any stocks mentioned.