Is It Too Late To Consider FLEX LNG (FLNG) After A 50% One-Year Rally?
FLEX LNG LTD (BM) FLNG | 30.47 | +3.99% |
- If you are wondering whether FLEX LNG is still reasonably priced or starting to look stretched, its recent share performance gives plenty to think about before looking at the numbers.
- The stock last closed at US$30.26, with returns of 0.6% over 7 days, 9.2% over 30 days, 22.7% year to date and 50.4% over the past year.
- Recent coverage around FLEX LNG has focused on its position within the energy sector and how investors view its earnings profile and capital returns, which can influence how much they are willing to pay for each dollar of cash flow or earnings. This kind of attention often feeds into sentiment around valuation and helps explain why the share price can shift even without company specific announcements.
- Even so, FLEX LNG currently holds a valuation score of 2 out of 6. The next sections will look at how different valuation approaches line up for this stock and then finish with a broader way to think about what that score really means.
FLEX LNG scores just 2/6 on our valuation checks. See what other red flags we found in the full valuation breakdown.
Approach 1: FLEX LNG Discounted Cash Flow (DCF) Analysis
A Discounted Cash Flow, or DCF, model looks at the cash FLEX LNG is expected to generate in the future and discounts those cash flows back to today to estimate what the business could be worth now.
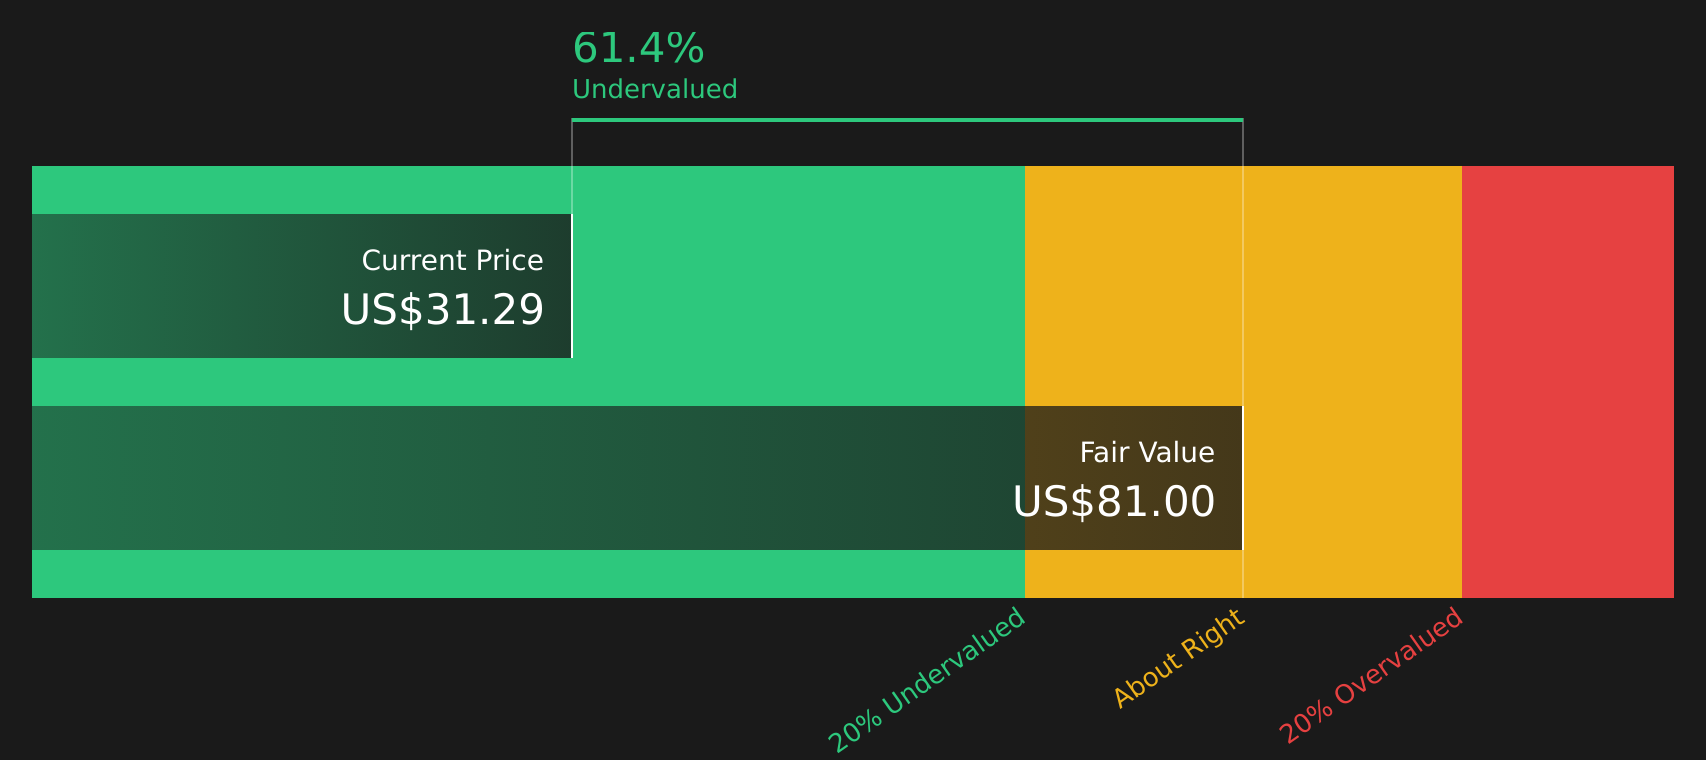
For FLEX LNG, the latest reported Free Cash Flow stands at about $140.7 million. Analysts provide a set of forward estimates, and Simply Wall St then extends those cash flow projections further using a 2 Stage Free Cash Flow to Equity model. Under this approach, projected Free Cash Flow reaches $369.3 million in 2035, with interim estimates such as $153 million in 2026 and $226 million in 2028, all expressed in dollars and then discounted back to today.
Putting all of those discounted projections together results in an estimated intrinsic value of about $108.60 per share. Compared with the recent share price of US$30.26, the model implies FLEX LNG trades at a 72.1% discount to this DCF value, which points to a wide gap between price and the cash flow based estimate.
Result: UNDERVALUED
Our Discounted Cash Flow (DCF) analysis suggests FLEX LNG is undervalued by 72.1%. Track this in your watchlist or portfolio, or discover 55 more high quality undervalued stocks.
Approach 2: FLEX LNG Price vs Earnings
For profitable companies, the P/E ratio is a useful way to think about what you are paying for each dollar of earnings. A higher P/E usually reflects higher expected growth or lower perceived risk, while a lower P/E can reflect lower growth expectations or higher risk.
FLEX LNG currently trades on a P/E of 21.88x. That sits above the Oil and Gas industry average of 16.43x and above the peer group average of 13.63x, which suggests the market is willing to pay more for its earnings than for many sector peers.
Simply Wall St also calculates a “Fair Ratio” for the stock, which is the P/E multiple that might be expected given factors such as earnings growth, profit margins, industry, market cap and specific risks. This Fair Ratio is 21.40x for FLEX LNG. Because it explicitly incorporates these company specific drivers, it can be more informative than a simple comparison with peers or the broad industry.
Comparing the current P/E of 21.88x with the Fair Ratio of 21.40x shows only a small gap, so the shares look slightly expensive on earnings, but broadly in line with what this framework suggests.
Result: ABOUT RIGHT

P/E ratios tell one story, but what if the real opportunity lies elsewhere? Start investing in legacies, not executives. Discover our 20 top founder-led companies.
Upgrade Your Decision Making: Choose your FLEX LNG Narrative
Earlier it was mentioned that there is an even better way to understand valuation. Meet Narratives, which are simply the stories investors tell about FLEX LNG and then link directly to a set of numbers, such as future revenue, earnings, margins and a fair value estimate. All of these are available as easy to use tools on Simply Wall St's Community page that millions of investors already use to compare fair value with the current share price, react quickly as Narratives update when news or earnings arrive, and see how views can differ. For example, there is an optimistic FLEX LNG Narrative that leans on the long charter backlog, young fleet and higher future margins to support a fair value above US$30.26, and a more cautious Narrative that focuses on vessel supply growth, high payouts and cost risks to support a fair value closer to the analyst consensus target of US$26.12.
Do you think there's more to the story for FLEX LNG? Head over to our Community to see what others are saying!

This article by Simply Wall St is general in nature. We provide commentary based on historical data and analyst forecasts only using an unbiased methodology and our articles are not intended to be financial advice. It does not constitute a recommendation to buy or sell any stock, and does not take account of your objectives, or your financial situation. We aim to bring you long-term focused analysis driven by fundamental data. Note that our analysis may not factor in the latest price-sensitive company announcements or qualitative material. Simply Wall St has no position in any stocks mentioned.