Is It Too Late To Consider Flywire (FLYW) After A 46% One Year Gain?
Flywire Corp. FLYW | 0.00 |
- Wondering if Flywire's current share price around US$14.61 still leaves room for value, or if most of the upside is already priced in.
- The stock is down 7.6% over the past week but up 2.7% over the last month, 5.1% year to date, and 46.1% over the past year, which can change how you think about both its potential and its risk.
- These moves come after a period where investors have been reassessing high growth payment and financial technology stocks. There has been attention on business models that focus on cross border payments and education, healthcare, and travel related clients. For Flywire, that context matters because sentiment around transaction based, fee driven revenue models can swing quickly as investors react to sector news and changing expectations.
- Right now Flywire has a valuation score of 3 out of 6, and the next sections will look at what different valuation methods suggest about the stock, before finishing with a way to bring those numbers together into a clearer picture of value.
Approach 1: Flywire Excess Returns Analysis
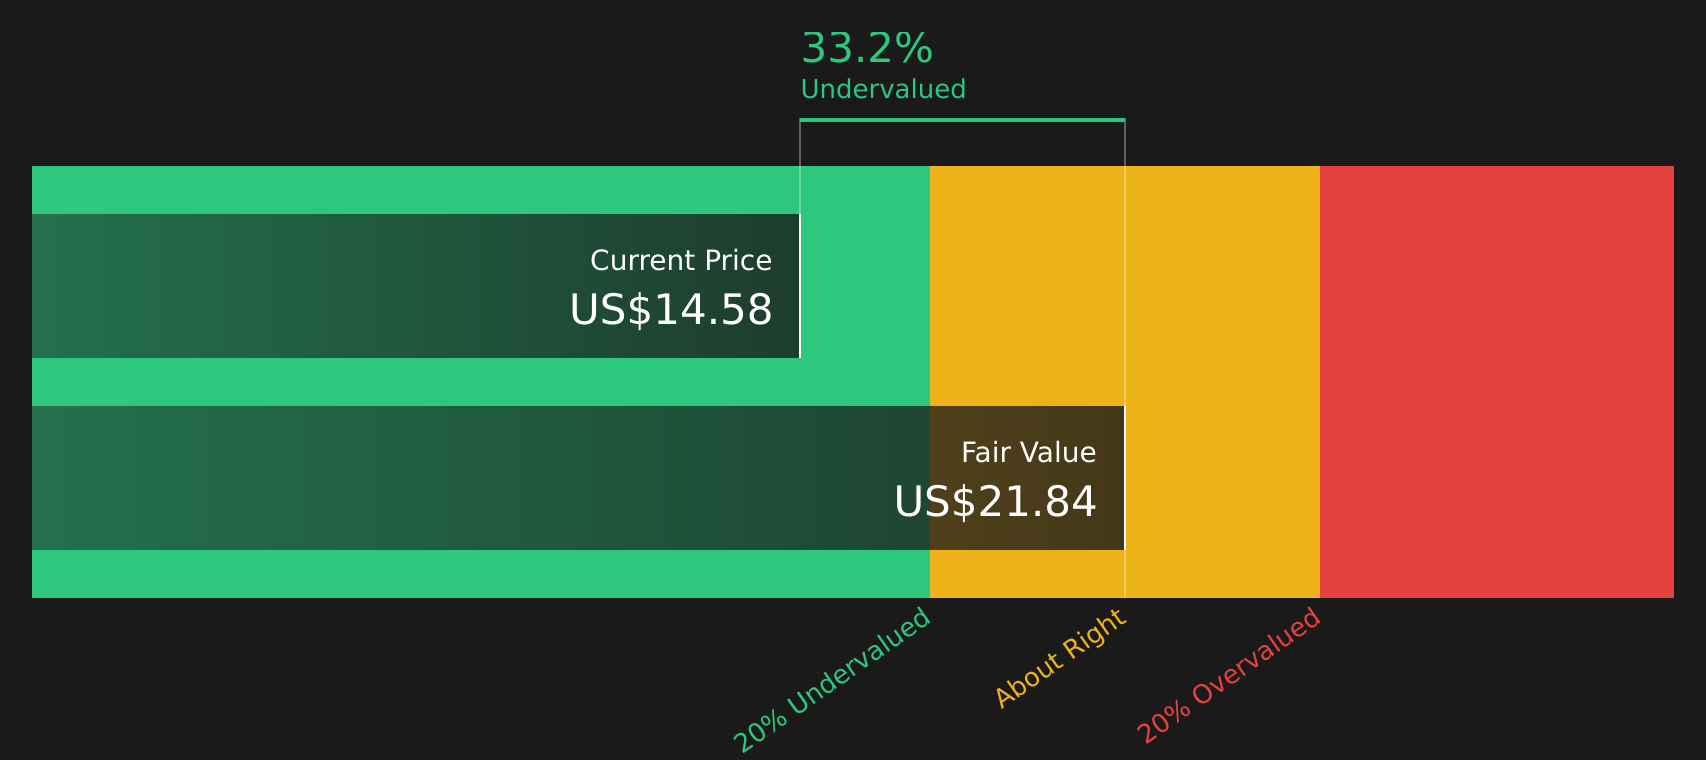
The Excess Returns model looks at how much value a company can create over and above the return that equity investors require. It starts with book value per share, estimates a sustainable earnings level, then checks how much of those earnings sit above the cost of equity.
For Flywire, the model uses a Book Value of $6.91 per share and a Stable EPS of $1.11 per share, based on weighted future Return on Equity estimates from 4 analysts. The Average Return on Equity is 12.62%, while the Cost of Equity is $0.63 per share, implying an Excess Return of $0.47 per share. The Stable Book Value is $8.79 per share, based on weighted future Book Value estimates from 4 analysts.
By capitalizing these excess returns, the model arrives at an intrinsic value of about $21.71 per share. Compared with the current share price around $14.61, this indicates the stock is trading at roughly a 32.7% discount, suggesting the Excess Returns view sees Flywire as undervalued on this basis.
Result: UNDERVALUED
Our Excess Returns analysis suggests Flywire is undervalued by 32.7%. Track this in your watchlist or portfolio, or discover 47 more high quality undervalued stocks.
Approach 2: Flywire Price vs Earnings
For profitable companies, the P/E ratio is a useful way to link what you pay for the stock with the earnings each share generates. It helps you see how many dollars investors are currently willing to pay for one dollar of earnings.
What counts as a “normal” P/E depends on what investors expect for future earnings and how risky those earnings appear. Higher expected growth or lower perceived risk can support a higher multiple, while slower growth or higher risk usually calls for a lower one.
Flywire’s current P/E is 59.76x, compared with the Diversified Financial industry average of about 16.30x and a peer average of 18.93x. Simply Wall St’s Fair Ratio estimate for Flywire is 21.77x. This Fair Ratio is a proprietary view of what the P/E could be given factors such as the company’s earnings growth profile, industry, profit margins, market cap and risk characteristics.
Because the Fair Ratio incorporates these company specific factors, it gives a more tailored reference point than a simple comparison with peers or broad industry averages. With Flywire trading at 59.76x against a Fair Ratio of 21.77x, the P/E based view suggests the stock is expensive relative to this benchmark.
Result: OVERVALUED

Wall Street's queuing for one rocket. While SpaceX counts down to its IPO, other companies tied to the new space race are already in orbit. → 20 Compelling Space Companies watchlist · Global Space Race Investing Ideas screener · Scan the sector by valuation on Rocket Lab's valuation page.
Upgrade Your Decision Making: Choose your Flywire Narrative
Earlier it was mentioned that there is an even better way to understand valuation. Meet Narratives, a simple tool on Simply Wall St’s Community page that lets you connect your view of Flywire’s story with your own forecast for revenue, earnings and margins, then link that to a Fair Value you can compare with today’s share price to help decide whether the stock looks attractive or not. Because Narratives update automatically when fresh news or earnings arrive, you can see in real time how a more bullish view, such as assuming Flywire is worth around US$22.00, stacks up against a more cautious view closer to US$13.00 and decide which story, and which Fair Value, best matches how you see the company.
For Flywire, however, we will make it really easy for you with previews of two leading Flywire Narratives:
Fair Value: US$22.00
Implied discount to this Fair Value vs the last close around US$14.61: about 33.6%.
Revenue growth assumption: 17.26%.
- Analysts in this camp see Flywire's Sertifi acquisition, AI rollout and global reach as ingredients for multi vertical growth and stronger profitability over time.
- They view regulatory complexity and digital payments infrastructure as supportive of stickier client relationships and recurring, higher margin revenue.
- The bullish setup links a Fair Value of US$22.00 to forecasts for higher earnings, wider margins and a P/E multiple that remains above the current industry level.
Fair Value: US$13.00
Implied premium to this Fair Value vs the last close around US$14.61: about 12.4%.
Revenue growth assumption: 17.04%.
- This view puts more weight on rising compliance costs, intense competition in cross border payments and the possibility of pressure on Flywire's transaction margins.
- It highlights risks from visa trends, geopolitics and the potential impact of newer payment technologies on Flywire's role in the payment chain.
- The bearish Fair Value of US$13.00 reflects assumptions for lower future profit margins and a P/E that, while reduced from today, still sits above the broader sector.
Both Narratives use the same tools but plug in different expectations. The real question is which set of assumptions feels closer to how you think Flywire's revenue, margins and risks will play out over time. See what the community is saying about Flywire
Do you think there's more to the story for Flywire? Head over to our Community to see what others are saying!

This article by Simply Wall St is general in nature. We provide commentary based on historical data and analyst forecasts only using an unbiased methodology and our articles are not intended to be financial advice. It does not constitute a recommendation to buy or sell any stock, and does not take account of your objectives, or your financial situation. We aim to bring you long-term focused analysis driven by fundamental data. Note that our analysis may not factor in the latest price-sensitive company announcements or qualitative material. Simply Wall St has no position in any stocks mentioned.