Is It Too Late To Consider Gilead Sciences (GILD) After Its Strong Multi‑Year Rally?
Gilead Sciences, Inc. GILD | 139.71 | -0.42% |
- If you are wondering whether Gilead Sciences is offering fair value at today's share price, this article walks through the numbers in a straightforward way so you can judge for yourself.
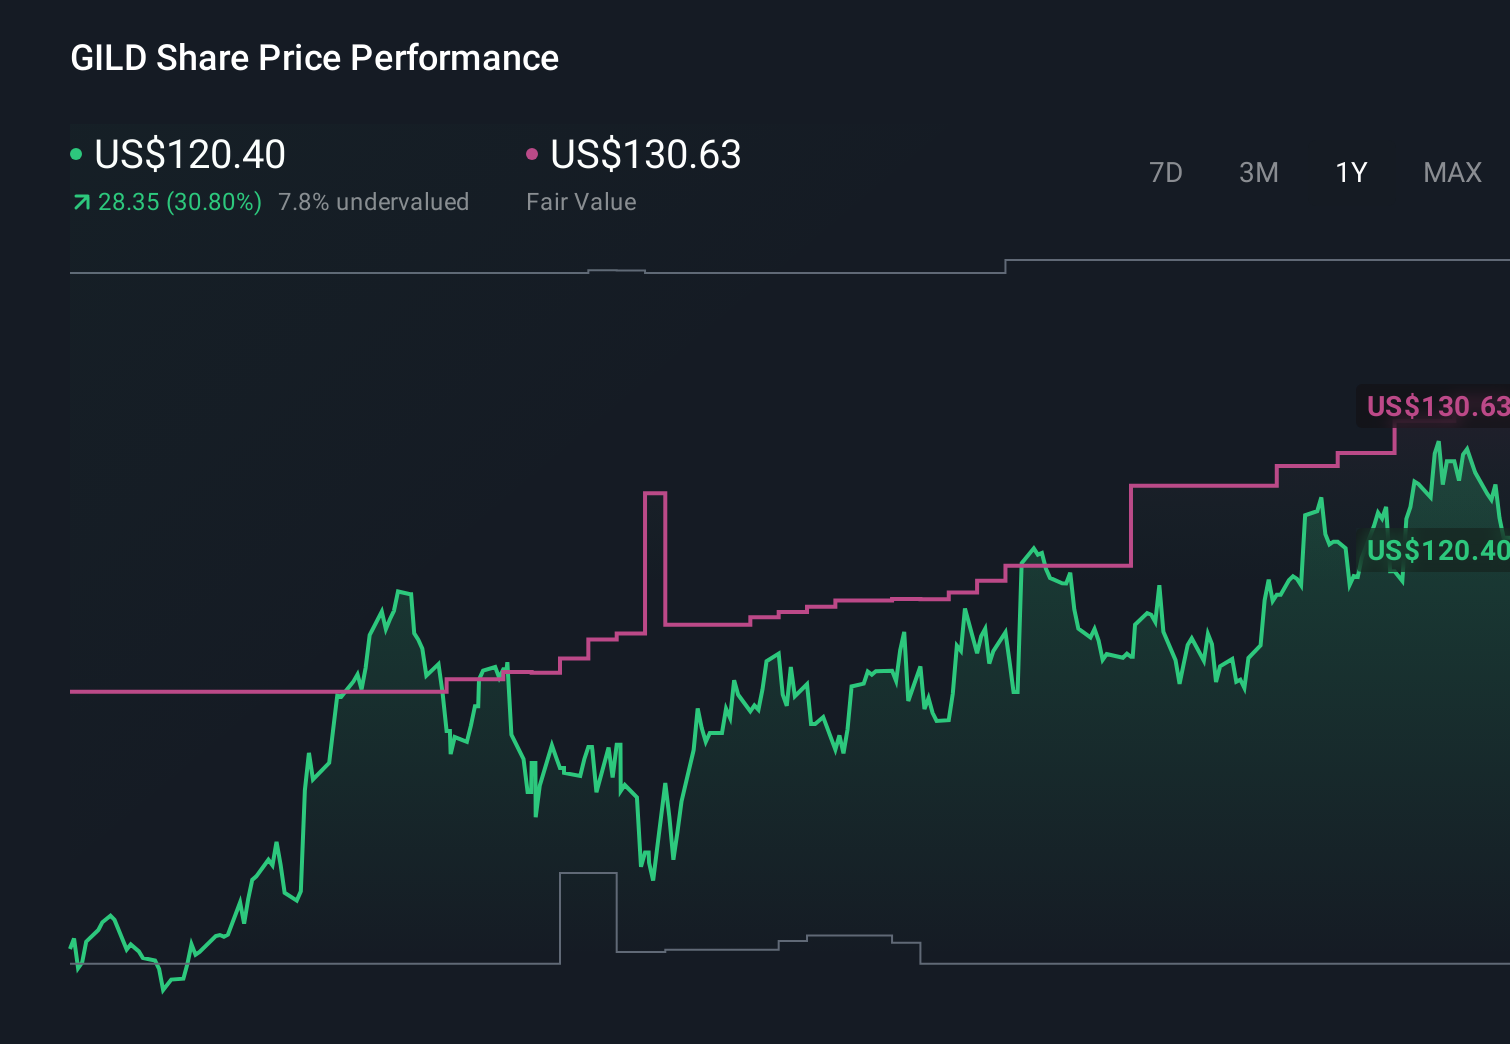
- With the stock at US$151.68, recent returns of 6.2% over 7 days, 25.3% over 30 days, 24.7% year to date, 63.3% over 1 year, 92.7% over 3 years and 174.8% over 5 years put a clear spotlight on how the market currently prices the business.
- Recent attention on Gilead Sciences has been shaped by news around its product pipeline, regulatory updates and partnership activity. Together, these factors influence how investors think about future cash flows and risks. These developments help explain why the share price has moved the way it has, and they provide useful context before you look at any valuation model.
- On our checks, Gilead Sciences has a valuation score of 4 out of 6. This suggests there are several metrics where the stock looks undervalued and a couple where it does not screen as cheaply. Next, we will compare different valuation approaches before finishing with a more complete way to think about what the shares might be worth.
Approach 1: Gilead Sciences Discounted Cash Flow (DCF) Analysis
A Discounted Cash Flow, or DCF, model estimates what a business could be worth by projecting its future cash flows and then discounting those back to today using a required return. It is essentially asking what you might reasonably pay now for the cash the company is expected to generate in the future.
For Gilead Sciences, the model used is a 2 Stage Free Cash Flow to Equity approach based on cash flow projections. The latest twelve month free cash flow is about US$9.1b. Analyst sourced projections are provided out to 2030, with free cash flow for that year estimated at US$15.5b, and Simply Wall St extrapolates additional years beyond the analyst horizon.
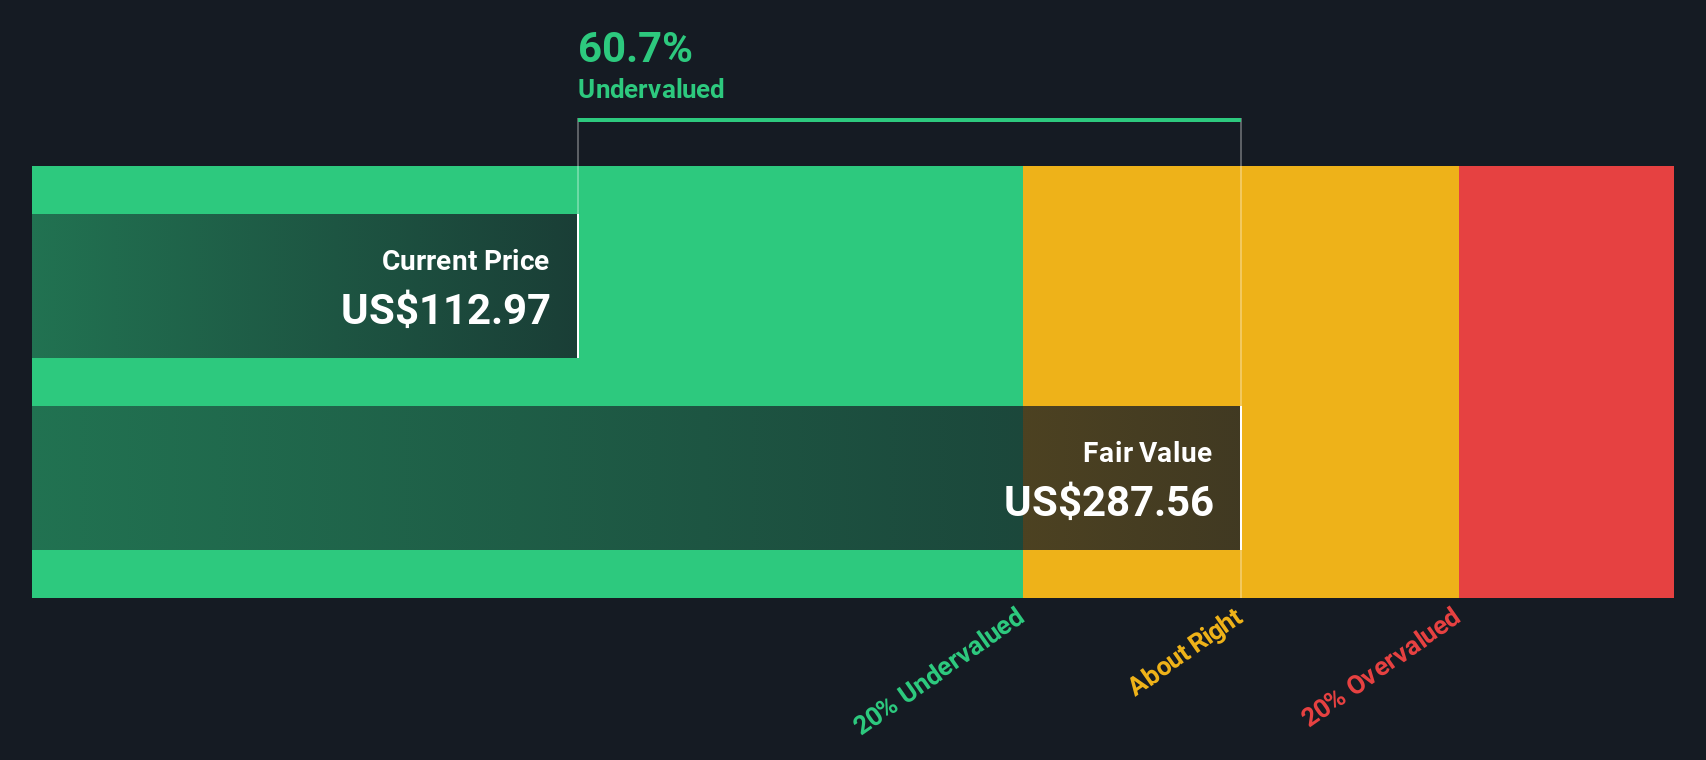
After discounting these projected cash flows back to today, the model arrives at an estimated intrinsic value of US$287.54 per share. Compared with the current share price of US$151.68, this implies the stock screens as about 47.2% undervalued on this DCF view.
Result: UNDERVALUED
Our Discounted Cash Flow (DCF) analysis suggests Gilead Sciences is undervalued by 47.2%. Track this in your watchlist or portfolio, or discover 52 more high quality undervalued stocks.
Approach 2: Gilead Sciences Price vs Earnings
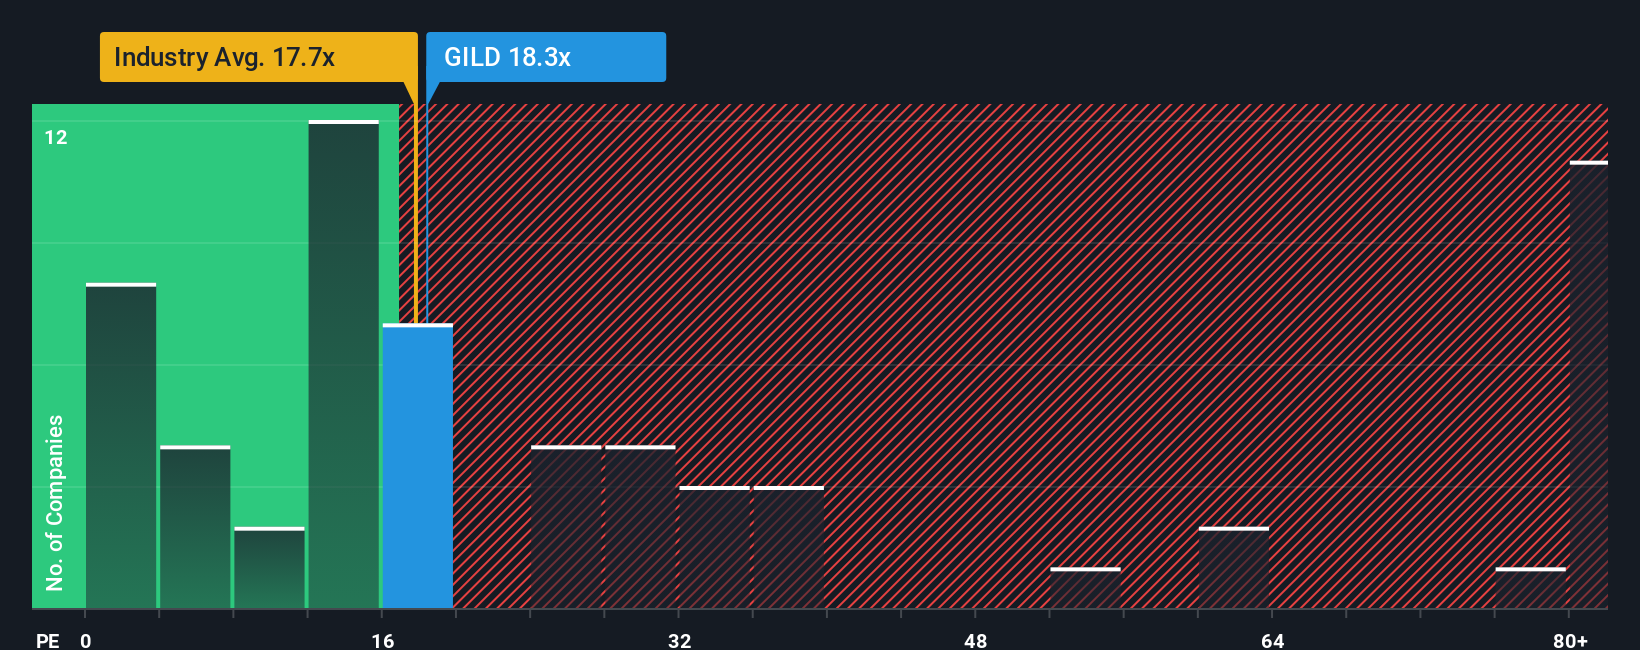
For a profitable company, the P/E ratio is a useful shorthand because it links what you pay per share to the earnings the business is currently generating. Investors usually accept a higher or lower P/E based on what they expect for future growth and how risky those earnings appear to be.
Gilead Sciences currently trades on a P/E of 23.2x. That sits above the Biotechs industry average of 22.0x, and below the peer group average of 42.5x. These simple comparisons give a quick sense of how the stock is priced, but they do not adjust for Gilead Sciences specific profile.
Simply Wall St also calculates a “Fair Ratio” for the P/E, which for Gilead Sciences is 29.2x. This is a proprietary estimate of the multiple that could be reasonable given factors like earnings growth, profitability, industry, market cap and risk. Because it blends these elements into a single yardstick, it can be more informative than looking at raw industry or peer averages alone. On this basis, Gilead Sciences current P/E of 23.2x is below the Fair Ratio of 29.2x, which indicates that the shares screen as undervalued on earnings.
Result: UNDERVALUED
P/E ratios tell one story, but what if the real opportunity lies elsewhere? Start investing in legacies, not executives. Discover our 22 top founder-led companies.
Upgrade Your Decision Making: Choose your Gilead Sciences Narrative
Earlier we mentioned that there is an even better way to understand valuation, so let us introduce you to Narratives, which are simply your own written story about Gilead Sciences that ties together your view on its products, competitive position and risks with a concrete forecast for future revenue, earnings and margins and a Fair Value that you can compare directly to today’s share price.
On Simply Wall St’s Community page, Narratives are an easy tool used by millions of investors. They let you set your assumptions, see how they translate into a financial model and then quickly check whether your Fair Value suggests the stock looks expensive or cheap relative to the live market price.
Narratives also stay current, because when new information such as news, earnings or updated analyst models comes in, the underlying numbers and Fair Value are refreshed. This allows you to see straight away whether your original story still holds up or needs revisiting.
For Gilead Sciences, one bullish Narrative currently anchors on a Fair Value of about US$159.00 per share, while a cautious Narrative sits closer to US$91.83. That spread reflects how two investors, looking at the same company, can reasonably reach very different conclusions about what the stock is worth today.
For Gilead Sciences, here are previews of two leading Gilead Sciences Narratives for you to review:
Fair Value: US$159.00 per share
Implied discount to Fair Value: about 4.6% based on the recent price of US$151.68
Revenue growth assumption: 6.63% a year
- Assumes extended strength in HIV and PrEP, with drugs like lenacapavir and Trodelvy helping Gilead tap into larger treatment and prevention markets.
- Highlights expectations for higher profit margins over time, supported by strong cash flows, a broad pipeline and no major loss of exclusivity events until 2033.
- Flags pricing pressure, regulatory risk and heavy reliance on successful new launches as key issues that could challenge this more optimistic view.
Fair Value: US$132.57 per share
Implied premium to Fair Value: about 14.4% based on the recent price of US$151.68
Revenue growth assumption: 3.69% a year
- Sees Gilead as heavily exposed to HIV, with long term earnings tied to policy decisions, pricing, and how treatment patterns evolve across prevention and therapy.
- Assumes solid cash generation and share buybacks, but questions how much oncology, cell therapy and newer launches can offset future patent and competition pressures.
- Emphasises execution risk around trials, approvals and real world uptake, and uses a Fair Value that sits closer to analyst consensus than the bullish case.
If you want to go deeper than these quick snapshots, it can help to read the full narratives behind these numbers and decide which one lines up more closely with how you see Gilead Sciences’ future, or to build your own version using your assumptions.
Do you think there's more to the story for Gilead Sciences? Head over to our Community to see what others are saying!
This article by Simply Wall St is general in nature. We provide commentary based on historical data and analyst forecasts only using an unbiased methodology and our articles are not intended to be financial advice. It does not constitute a recommendation to buy or sell any stock, and does not take account of your objectives, or your financial situation. We aim to bring you long-term focused analysis driven by fundamental data. Note that our analysis may not factor in the latest price-sensitive company announcements or qualitative material. Simply Wall St has no position in any stocks mentioned.