Is It Too Late To Consider Globus Medical (GMED) After Its Strong Share Price Run?
Globus Medical Inc Class A GMED | 0.00 |
- If you are wondering whether Globus Medical's current share price reflects its true worth, you are not alone. This article walks through what the numbers are saying about value.
- The stock last closed at US$91.40, with returns of 4.0% over 7 days, 5.5% over 30 days, 4.7% year to date, 28.8% over 1 year, 57.3% over 3 years, and 31.2% over 5 years. This gives useful context before looking at valuation.
- Recent news flow around Globus Medical has focused on its position within the medical devices space and ongoing interest in companies linked to surgical technologies. This backdrop helps explain why investors are paying close attention to how much they are being asked to pay for each dollar of potential future performance.
- Globus Medical currently has a valuation score of 3/6, and the next sections will walk through different ways of assessing value before finishing with a broader framework that can help you put all these methods into a clearer big picture.
Approach 1: Globus Medical Discounted Cash Flow (DCF) Analysis
A Discounted Cash Flow, or DCF, model estimates what a business could be worth by projecting its future cash flows and discounting them back to today's value using a required return.
For Globus Medical, the model used is a 2 Stage Free Cash Flow to Equity approach. The company currently reports last twelve months free cash flow of $603.6 million. Analyst inputs extend out a few years, including a projected free cash flow of $510.85 million in 2027. Simply Wall St then extrapolates additional years using modest growth assumptions in its ten year free cash flow projections.
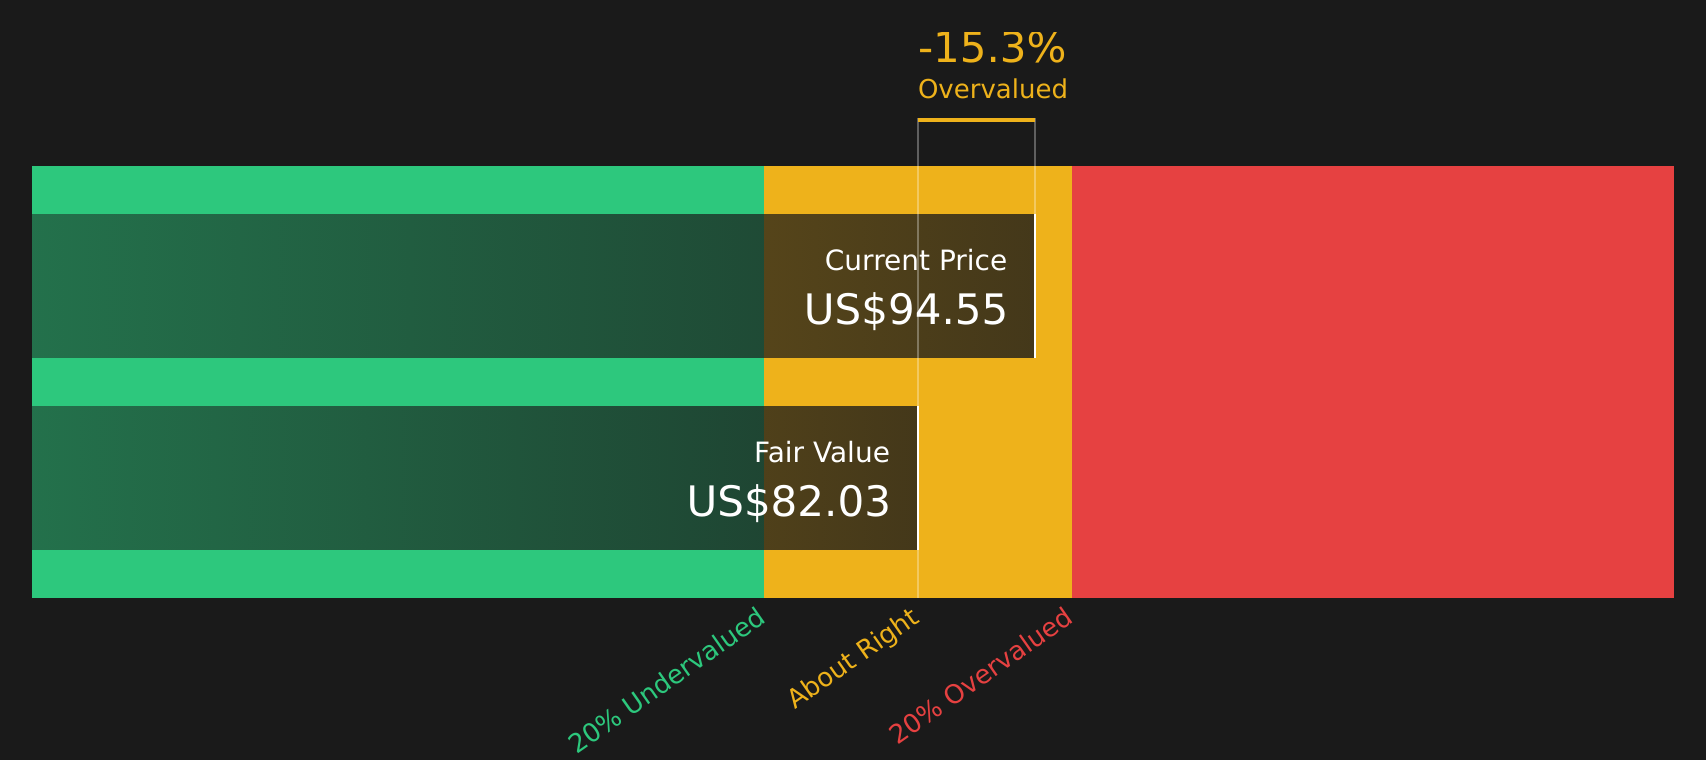
When all those projected cash flows are discounted back, the model arrives at an estimated intrinsic value of $82.08 per share. Compared with the recent share price of $91.40, the DCF output suggests Globus Medical is around 11.4% overvalued based on these inputs and assumptions.
Result: OVERVALUED
Our Discounted Cash Flow (DCF) analysis suggests Globus Medical may be overvalued by 11.4%. Discover 62 high quality undervalued stocks or create your own screener to find better value opportunities.
Approach 2: Globus Medical Price vs Earnings
For profitable companies, the P/E ratio is often a useful shorthand because it links what you pay for each share directly to the earnings that support that share. It helps you see how much the market is willing to pay for each dollar of profit.
What counts as a "normal" P/E depends on what investors expect for future growth and how much risk they see. Higher expected growth or lower perceived risk can justify a higher P/E, while lower growth or higher risk usually supports a lower P/E.
Globus Medical currently trades on a P/E of 23.0x, compared with the Medical Equipment industry average of about 26.3x and a peer average of 46.1x. Simply Wall St also calculates a proprietary Fair Ratio of 22.3x. This Fair Ratio represents the P/E that might be expected given factors such as Globus Medical's earnings growth profile, profit margins, industry, market cap and risk characteristics.
Because the Fair Ratio blends these company specific drivers, it can be more informative than a simple comparison with peers or the industry, which may have very different growth, risk and profitability profiles. With Globus Medical trading modestly above its Fair Ratio, the shares appear slightly overvalued on this P/E framework.
Result: OVERVALUED

P/E ratios tell one story, but what if the real opportunity lies elsewhere? Start investing in legacies, not executives. Discover our 19 top founder-led companies.
Upgrade Your Decision Making: Choose your Globus Medical Narrative
Earlier it was mentioned that there is an even better way to understand valuation. This is where Narratives come in, a simple tool on Simply Wall St's Community page that lets you combine your view of Globus Medical's story with explicit forecasts for revenue, earnings, margins and a Fair Value that you can compare directly with the current share price to decide whether the stock looks attractive or expensive on your assumptions.
A Narrative is essentially your investment story written into numbers. It links what you believe about Globus Medical's products, acquisitions and competitive position to a forecast, and then to a Fair Value that updates automatically when new news, earnings or guidance are added to the platform.
For example, one Globus Medical Narrative currently anchors to a Fair Value of US$123.0, reflecting a more optimistic view that assumes earnings of US$631.4m by 2029 on a P/E of 32.9x. Another more cautious Narrative aligns with a Fair Value of US$90.0 and assumes earnings of US$462.2m by 2028 on a P/E of 22.8x. Seeing those side by side helps you decide which story feels closer to your own expectations before you act.
For Globus Medical however, we will make it really easy for you with previews of two leading Globus Medical Narratives:
Fair Value: US$123.0
Gap vs current price: around 25.7% below this Fair Value
Revenue growth assumption: 8.6% per year
- Analysts in this camp see Globus Medical using cost actions, manufacturing automation and integration synergies to support higher margins and earnings over time.
- They expect the Excelsius platform, XR headset and broader technology ecosystem to support recurring software and disposables revenue as hospitals adopt more robotics and digital tools.
- This view is based on continued progress in US Core Spine, international expansion and contributions from Nevro to justify a higher Fair Value and a higher future P/E multiple.
Fair Value: US$90.0
Gap vs current price: around 1.6% above this Fair Value
Revenue growth assumption: 6.9% per year
- More cautious analysts focus on extended sales cycles, integration work and supply chain issues that could limit how quickly margins and earnings progress.
- They highlight pricing pressure, value based care trends and dependence on surgical volumes as ongoing headwinds for revenue growth and profitability.
- This group also points to integration risk from NuVasive and Nevro and strong competition in spine and enabling technologies as reasons to anchor expectations to a lower Fair Value and P/E multiple.
If you want to see how other investors are joining these dots and what assumptions they are changing, it is worth reviewing the wider range of Community views for Globus Medical through See what the community is saying about Globus Medical.
Do you think there's more to the story for Globus Medical? Head over to our Community to see what others are saying!

This article by Simply Wall St is general in nature. We provide commentary based on historical data and analyst forecasts only using an unbiased methodology and our articles are not intended to be financial advice. It does not constitute a recommendation to buy or sell any stock, and does not take account of your objectives, or your financial situation. We aim to bring you long-term focused analysis driven by fundamental data. Note that our analysis may not factor in the latest price-sensitive company announcements or qualitative material. Simply Wall St has no position in any stocks mentioned.