Is It Too Late To Consider ImmunityBio (IBRX) After Its Recent Share Price Surge?
ImmunityBio Inc IBRX | 0.00 |
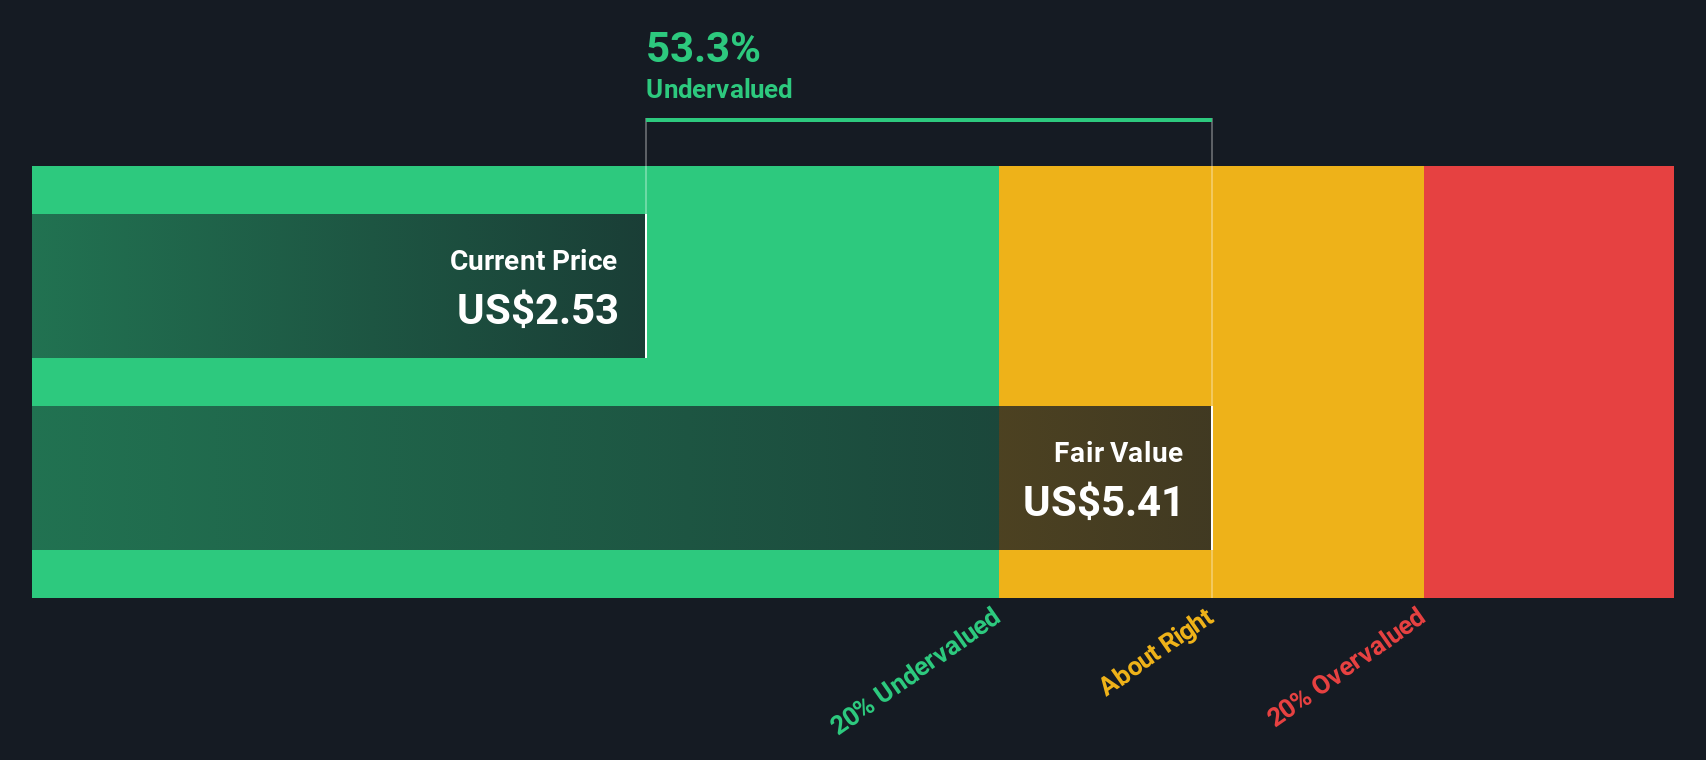
- If you are wondering whether ImmunityBio's share price still makes sense after its recent run, the key question is how the current market price lines up with the underlying valuation.
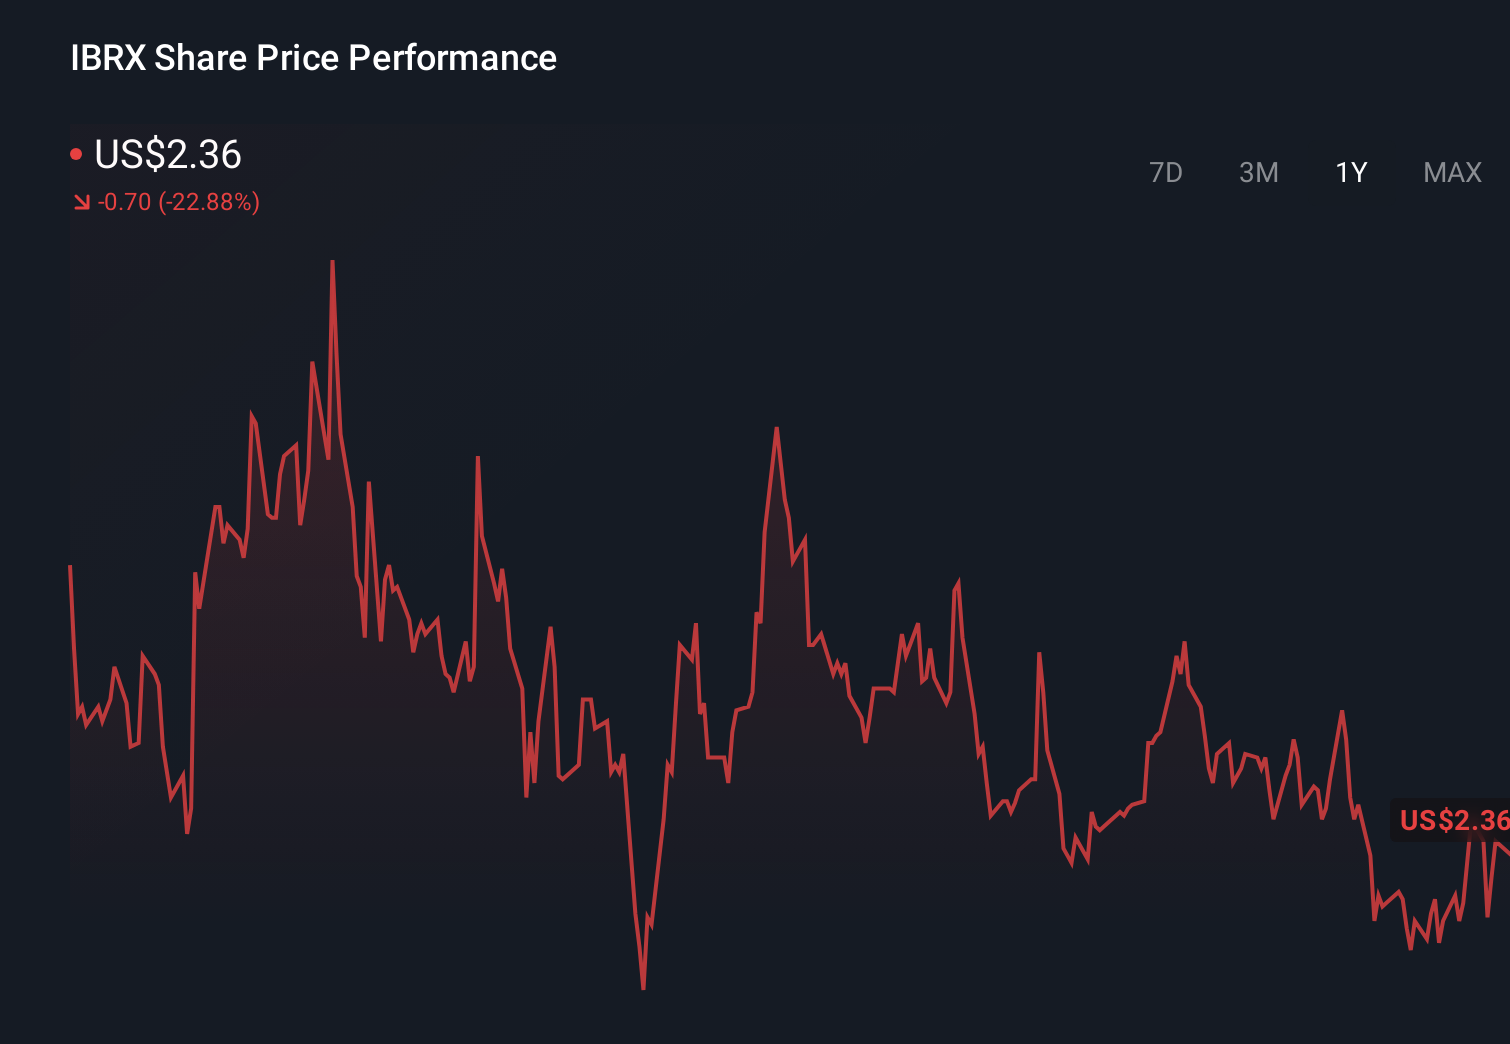
- The stock last closed at US$6.45, with returns of 16.8% over 7 days, 201.4% over 30 days, 219.3% year to date and 103.5% over 1 year. This naturally raises questions about both upside potential and risk.
- Recent news around ImmunityBio has largely focused on its progress in the pharmaceuticals and biotech space and how that relates to its listed status on the Nasdaq under the ticker IBRX. This context, along with market attention on its drug pipeline and regulatory milestones, has helped frame how investors view the recent price moves.
- On our framework, ImmunityBio currently has a valuation score of 2 out of 6, meaning it screens as undervalued on two checks. Next, we look at how different valuation methods assess the stock, before ending with a more rounded way to think about value beyond the headline metrics.
ImmunityBio scores just 2/6 on our valuation checks. See what other red flags we found in the full valuation breakdown.
Approach 1: ImmunityBio Discounted Cash Flow (DCF) Analysis
A Discounted Cash Flow, or DCF, model takes projected future cash flows and discounts them back to today to estimate what the business might be worth right now.
For ImmunityBio, the latest twelve month free cash flow is a loss of about US$373.9 million. Analysts have provided free cash flow estimates out to 2028, and beyond that, Simply Wall St extends the projections. By 2030, free cash flow is projected at US$556.5 million, with interim years moving from negative to positive figures based on those analyst inputs and model assumptions.
Using a 2 Stage Free Cash Flow to Equity model, these projected cash flows are discounted back to today to arrive at an estimated intrinsic value of US$18.13 per share. Compared with the recent share price of US$6.45, the model output implies the stock trades at roughly a 64.4% discount to this estimate, which indicates it screens as undervalued on this approach.
Result: UNDERVALUED
Our Discounted Cash Flow (DCF) analysis suggests ImmunityBio is undervalued by 64.4%. Track this in your watchlist or portfolio, or discover 866 more undervalued stocks based on cash flows.
Approach 2: ImmunityBio Price vs Book
For companies where the balance sheet matters a lot, the price to book, or P/B, ratio can be a useful cross check because it compares the market value of the equity with the accounting value of net assets.
In general, higher expected growth and lower perceived risk can justify a higher “normal” P/B multiple, while slower growth or higher risk tends to support a lower one. So context really matters when you compare any single ratio.
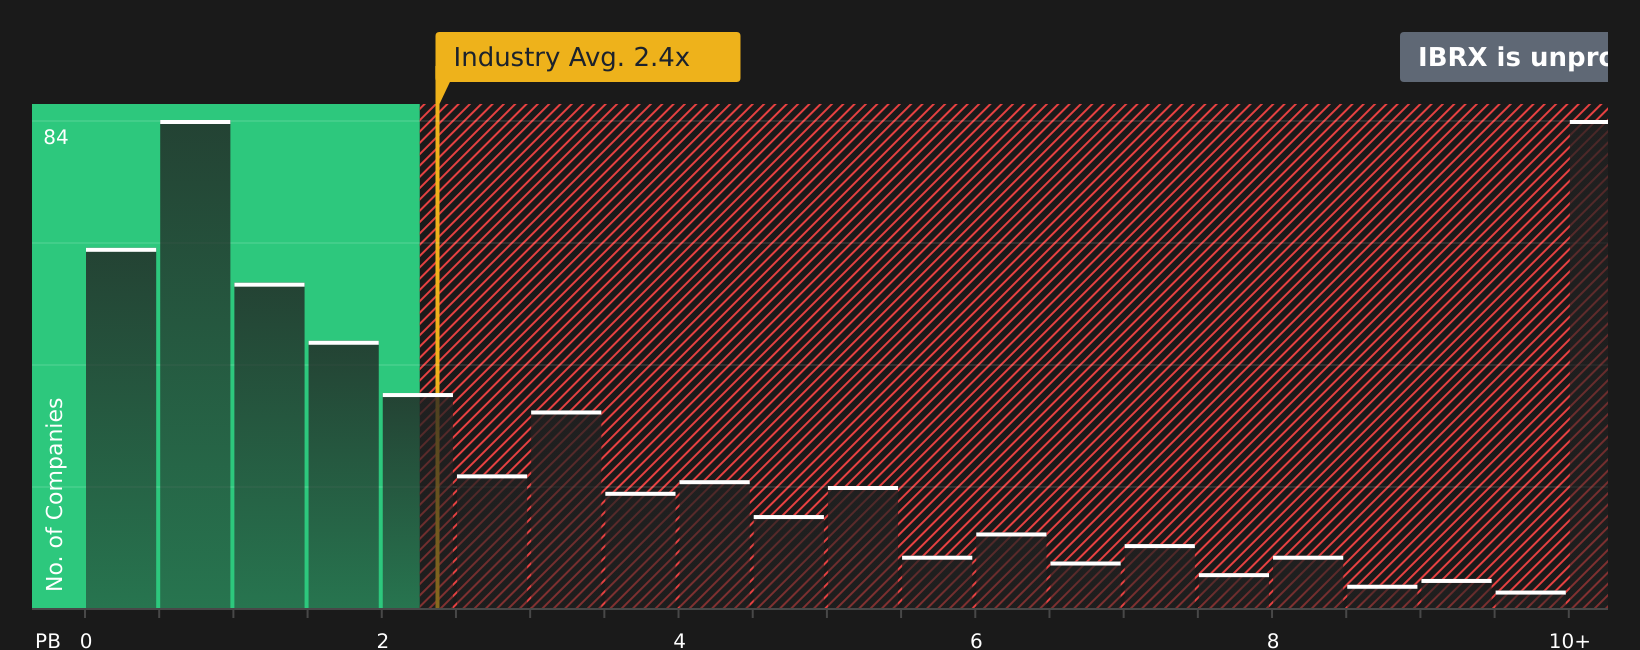
ImmunityBio’s current P/B ratio is about 12.12x. That sits above the Biotechs industry average of around 2.73x and also above the peer group average of roughly 10.49x. Simply Wall St’s Fair Ratio is a proprietary estimate of what a suitable P/B multiple might be, given factors like growth outlook, profit margins, industry, market cap and company specific risks. Because it is tailored to the company’s own profile, it aims to be more informative than a simple comparison with broad industry or peer averages, which can mix very different business models together.
As the Fair Ratio figure is not available here, it is not possible to draw a clear conclusion on whether the current 12.12x P/B screens as high, low, or about right on this framework.
Result: ABOUT RIGHT
P/B ratios tell one story, but what if the real opportunity lies elsewhere? Discover 1430 companies where insiders are betting big on explosive growth.
Upgrade Your Decision Making: Choose your ImmunityBio Narrative
Earlier we mentioned that there is an even better way to understand valuation, so let us introduce you to Narratives, which are simply your own story about a company tied directly to your assumptions for fair value, future revenue, earnings and margins.
Instead of only looking at ratios, you set out what you think ImmunityBio’s future could look like, turn that into a forecast, and then see what that implies for a fair value number that you can compare with today’s share price.
Narratives on Simply Wall St, available on the Community page used by millions of investors, make this process very approachable because the platform links your story to a model and then keeps that view updated when new information like news or earnings is added.
That way you can quickly see whether your fair value is above or below the current price, which can help you decide if ImmunityBio looks attractive to you right now or if it belongs on a watchlist, and different investors can easily see why one Narrative points to a much higher value than another more cautious view using the same shared data.
Do you think there's more to the story for ImmunityBio? Head over to our Community to see what others are saying!
This article by Simply Wall St is general in nature. We provide commentary based on historical data and analyst forecasts only using an unbiased methodology and our articles are not intended to be financial advice. It does not constitute a recommendation to buy or sell any stock, and does not take account of your objectives, or your financial situation. We aim to bring you long-term focused analysis driven by fundamental data. Note that our analysis may not factor in the latest price-sensitive company announcements or qualitative material. Simply Wall St has no position in any stocks mentioned.