Is It Too Late To Consider Janus Henderson Group (JHG) After Its Strong Multi‑Year Run?
Janus Henderson Group PLC JHG | 51.50 | +0.16% |
- If you are wondering whether Janus Henderson Group's current share price still offers value or if most of the opportunity is already priced in, this breakdown is designed to help you frame that question clearly.
- The stock recently closed at US$48.05, with returns of 0.4% over the last 7 days, 0.8% over 30 days, 0.6% year to date, 15.4% over 1 year, 109.9% over 3 years and 88.7% over 5 years. These figures naturally raise questions about how its valuation stacks up today.
- Recent coverage around Janus Henderson Group has focused on its position in the diversified financials space and how investors are weighing the business against other asset managers in the market. This attention provides useful context as we think about whether the current price reflects what the underlying business may be worth.
- On Simply Wall St's valuation checks, Janus Henderson Group currently scores 3 out of 6. Next we will look at what different methods suggest about fair value, before finishing with a framework that can help you interpret valuation in a more complete way.
Approach 1: Janus Henderson Group Excess Returns Analysis
The Excess Returns model asks a simple question: is Janus Henderson Group generating returns on its equity that sit above the return investors require, and if so, what is that stream of excess worth today?
For Janus Henderson Group, the model works off a Book Value of US$30.89 per share and a Stable EPS estimate of US$3.04 per share, based on the median return on equity over the past 5 years. The implied Cost of Equity is US$2.99 per share, so the Excess Return comes out at US$0.05 per share. That excess is tied to an Average Return on Equity of 8.79% and a Stable Book Value estimate of US$34.58 per share, drawn from weighted future book value estimates from 2 analysts.
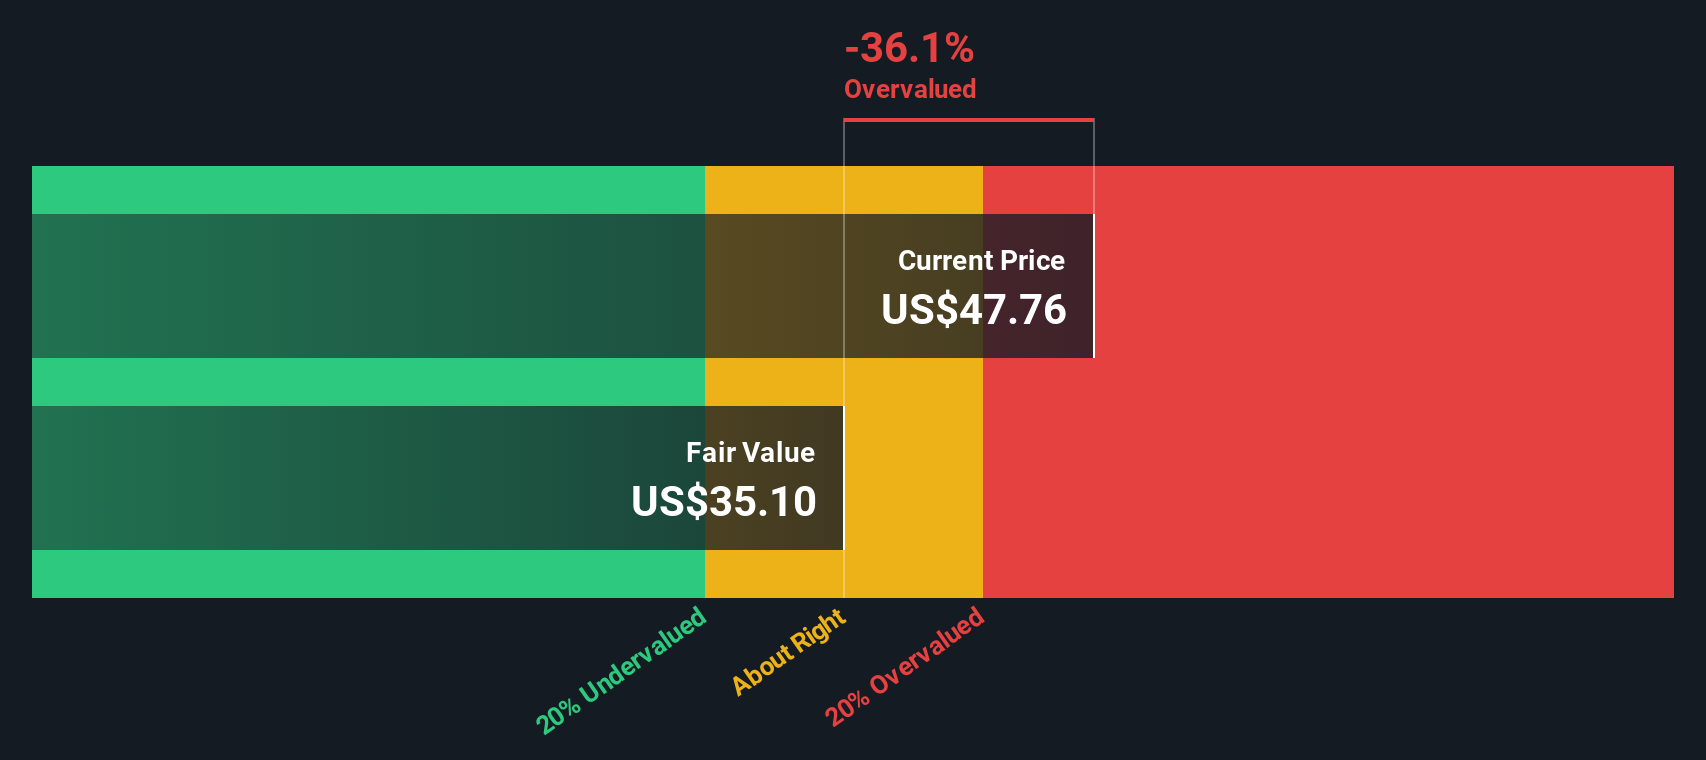
When Simply Wall St converts those future excess returns into today’s dollars, the model produces an intrinsic value of about US$35.43 per share. Compared to the recent share price of US$48.05, the Excess Returns model suggests the stock is about 35.6% overvalued.
Result: OVERVALUED
Our Excess Returns analysis suggests Janus Henderson Group may be overvalued by 35.6%. Discover undervalued stocks or create your own screener to find better value opportunities.
Approach 2: Janus Henderson Group Price vs Earnings
For a profitable company like Janus Henderson Group, the P/E ratio is a straightforward way to think about what you are paying for each dollar of earnings. It ties the share price directly to current earnings, which is usually more intuitive than revenue or book value for established asset managers.
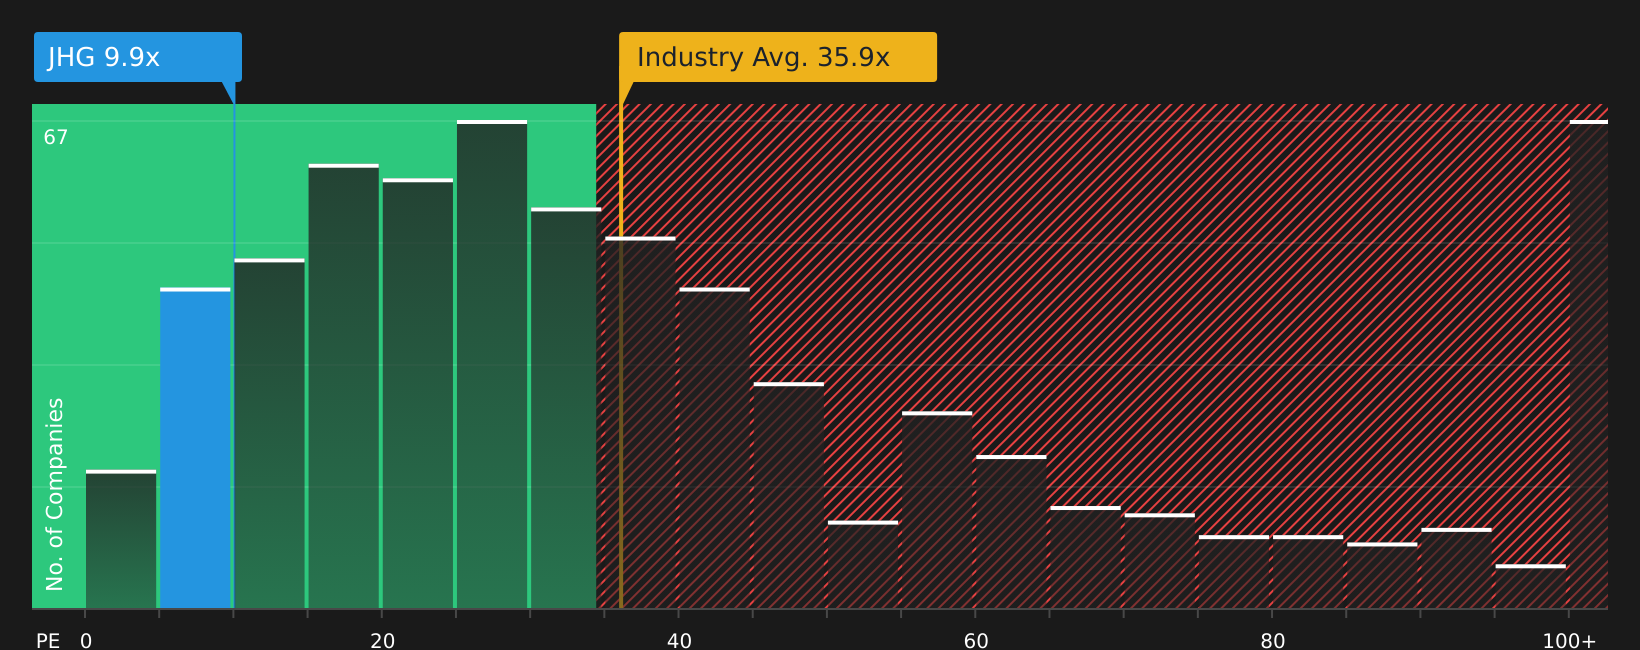
In general, investors tend to accept a higher P/E when they expect stronger earnings growth or see lower risk, and a lower P/E when growth expectations are modest or risks feel higher. Janus Henderson Group currently trades on a P/E of 14.17x. That sits below the Capital Markets industry average of 24.45x and below the peer average of 17.99x.
Simply Wall St’s Fair Ratio for Janus Henderson Group is 14.50x. This is a proprietary estimate of what a reasonable P/E could be given factors like the company’s earnings growth profile, industry, profit margins, market cap and risk characteristics. Because it blends these company specific inputs, the Fair Ratio can be more informative than a simple comparison with peers or the broader industry. With the current P/E of 14.17x sitting slightly below the Fair Ratio of 14.50x, the shares screen as mildly undervalued on this metric.
Result: UNDERVALUED
P/E ratios tell one story, but what if the real opportunity lies elsewhere? Discover 1417 companies where insiders are betting big on explosive growth.
Upgrade Your Decision Making: Choose your Janus Henderson Group Narrative
Earlier we mentioned that there is an even better way to understand valuation, so let us introduce you to Narratives, a simple way to connect your view of Janus Henderson Group with the numbers behind it.
A Narrative is your story about the company, paired with your own assumptions for fair value and for how revenue, earnings and margins might develop over time, so you are not just looking at ratios in isolation.
On Simply Wall St, Narratives live in the Community page. They link that story to a full financial forecast and a fair value estimate, then compare it with the current share price to help you decide whether the stock looks attractive, fairly priced or expensive based on your view.
Because Narratives update automatically when new information such as news or earnings is available, your fair value view can stay in sync with what is happening with Janus Henderson Group. You can quickly see, for example, how one investor might see the shares as attractive at US$35 while another only feels comfortable closer to US$30.
Do you think there's more to the story for Janus Henderson Group? Head over to our Community to see what others are saying!
This article by Simply Wall St is general in nature. We provide commentary based on historical data and analyst forecasts only using an unbiased methodology and our articles are not intended to be financial advice. It does not constitute a recommendation to buy or sell any stock, and does not take account of your objectives, or your financial situation. We aim to bring you long-term focused analysis driven by fundamental data. Note that our analysis may not factor in the latest price-sensitive company announcements or qualitative material. Simply Wall St has no position in any stocks mentioned.