Is It Too Late To Consider Kosmos Energy (KOS) After Its Recent Share Price Surge?
Kosmos Energy Ltd. KOS | 3.04 | -1.94% |
- Wondering if Kosmos Energy's share price still offers value after a big run, or if the opportunity has already passed you by?
- The stock closed at US$2.66, with returns of 32.3% over 7 days, 58.3% over 30 days, 197.9% year to date, 15.2% over 1 year, and longer term returns over 3 and 5 years of negative 59.6% and negative 8.3%.
- These moves sit against a backdrop of ongoing interest in energy producers, where investors often weigh shorter term price strength against longer term share price records. Recent market conversations around Kosmos Energy have focused on how its profile as an exploration and production company fits into changing investor attitudes to the sector and risk.
- Kosmos Energy currently has a value score of 4/6. The rest of this article will walk through how different valuation methods assess the stock, and close with a more complete way to think about valuation that goes beyond any single model.
Approach 1: Kosmos Energy Discounted Cash Flow (DCF) Analysis
A Discounted Cash Flow model estimates what a company might be worth by projecting its future cash flows and discounting them back to today’s value using a required rate of return.
For Kosmos Energy, the latest twelve month free cash flow is a loss of about US$468.5 million. Analysts provide detailed free cash flow estimates for the next several years, and Simply Wall St extends these out using a 2 Stage Free Cash Flow to Equity model. Within that projection, free cash flow for 2030 is set at US$501 million, with intermediate years such as 2026 and 2027 at US$424.7 million and US$326.4 million respectively, all in US$.
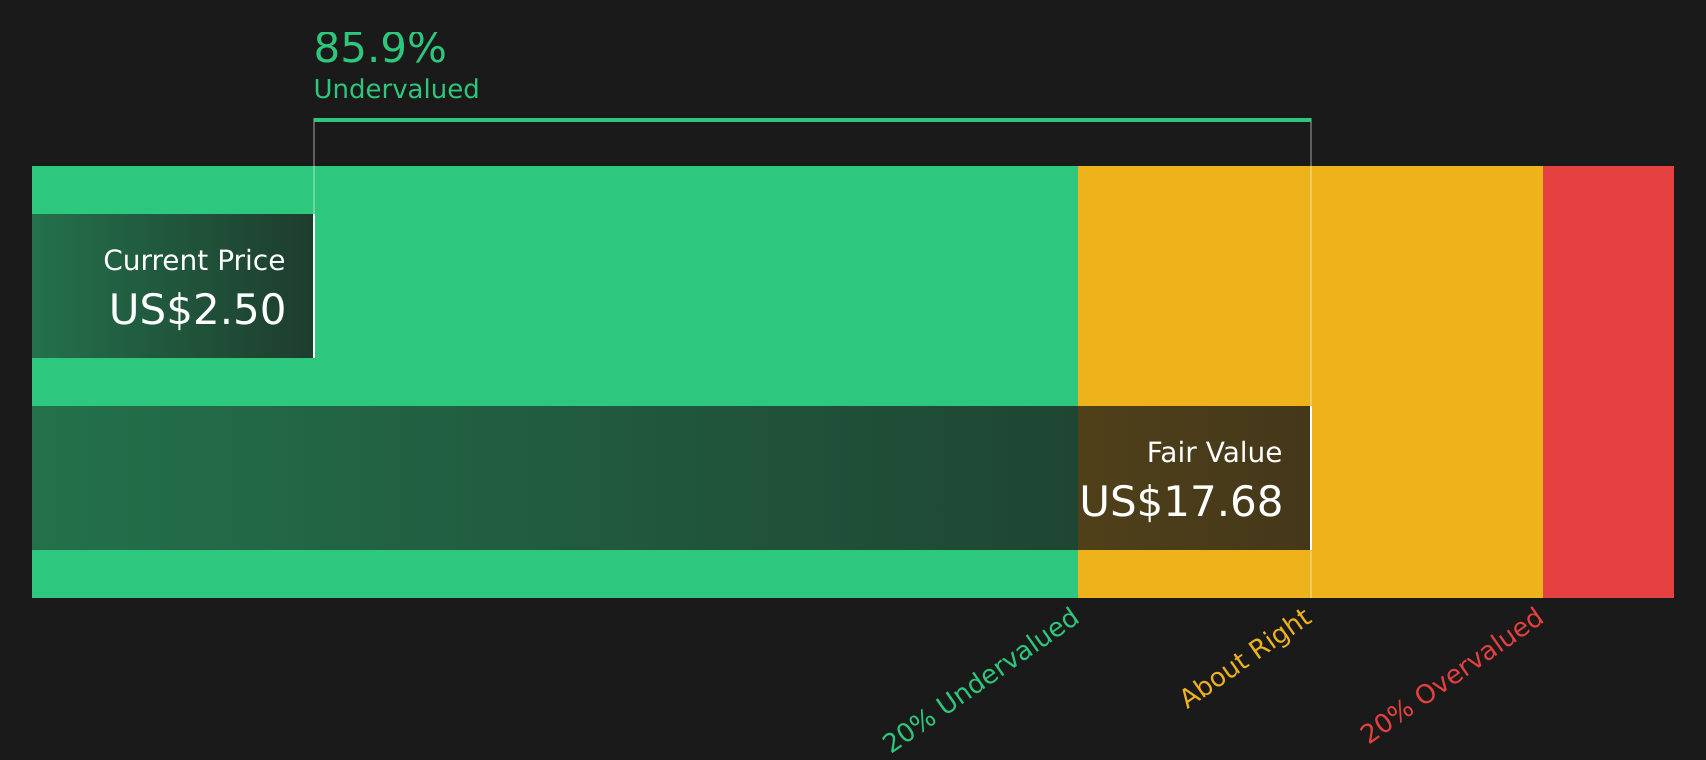
When all these projected cash flows are discounted back and summed, the model arrives at an estimated intrinsic value of about US$10.92 per share. Compared with the recent share price of US$2.66, this implies an intrinsic discount of roughly 75.7%, which indicates that the shares are priced well below this DCF estimate.
Result: UNDERVALUED
Our Discounted Cash Flow (DCF) analysis suggests Kosmos Energy is undervalued by 75.7%. Track this in your watchlist or portfolio, or discover 49 more high quality undervalued stocks.
Approach 2: Kosmos Energy Price vs Sales
For companies where earnings can swing around, the P/S ratio is often a useful way to think about value, because it compares what you pay per share with the revenue the business generates, without being distorted by short term profit volatility.
What counts as a "normal" or "fair" P/S ratio often reflects how quickly revenue is expected to grow and how risky the business is. Higher growth and lower perceived risk can support higher multiples, while slower growth or higher risk typically line up with lower ones.
Kosmos Energy currently trades on a P/S of 1.22x. That sits below the Oil and Gas industry average P/S of 1.99x and well below the peer group average of 6.94x. Simply Wall St also provides a proprietary “Fair Ratio” for Kosmos Energy of 1.17x, which is the P/S level suggested after considering factors like its earnings profile, industry, profit margins, market size and identified risks.
This Fair Ratio aims to be more tailored than a simple comparison with peers or the broad industry, because it blends those qualitative and quantitative inputs into one reference point. With the current P/S at 1.22x versus a Fair Ratio of 1.17x, Kosmos Energy screens as slightly above that tailored estimate but still quite close to it.
Result: ABOUT RIGHT

P/S ratios tell one story, but what if the real opportunity lies elsewhere? Start investing in legacies, not executives. Discover our 20 top founder-led companies.
Upgrade Your Decision Making: Choose your Kosmos Energy Narrative
Earlier it was mentioned that there is an even better way to understand valuation. Meet Narratives, which let you attach a clear story about Kosmos Energy to the numbers you see, such as your own view of fair value and expectations for future revenue, earnings and margins. You can then link that story to a forecast and a valuation that you can compare with the current share price.
On Simply Wall St, Narratives live in the Community page and are built by investors who set assumptions and a fair value that match their viewpoint. For example, you might see one Kosmos Energy Narrative that leans toward the more optimistic fair value around US$3.50 and another that aligns with a more cautious fair value near US$2.00. Both will automatically refresh when new information like earnings or news is added. This can help you decide whether the gap between fair value and the live price looks large enough for you to consider buying, holding or selling.
For Kosmos Energy, we have made it easy for you with previews of two leading Kosmos Energy Narratives:
Fair value in this bullish narrative: US$3.50 per share
Implied discount to that fair value versus the latest close of US$2.66: about 24.0%
Revenue growth assumption: 6.84%
- Assumes higher production volumes and margin expansion, with analysts in the optimistic camp expecting revenue growth, rising profit margins and stronger free cash flow over time.
- Frames fair value using a discounted view of future earnings where Kosmos Energy trades on a lower P/E than the wider GB Oil and Gas industry, based on those bullish earnings estimates.
- Highlights meaningful risks around energy transition, asset concentration, regulation, financing conditions and competition, and encourages you to test the bullish assumptions against your own expectations.
Fair value in this more cautious narrative: US$2.51 per share
Implied premium to that fair value versus the latest close of US$2.66: about 6.0%
Revenue growth assumption: 5.78%
- Builds around analyst consensus, with moderate revenue growth, a smaller lift in profit margins and a P/E assumption that sits above the current GB Oil and Gas industry level.
- Points to ongoing debt, equity issuance and impairment charges as constraints that can affect future returns to shareholders and the valuation multiple investors are willing to pay.
- Flags exposure to political, regulatory and energy transition pressures as well as potential variability in exploration and development outcomes, which together support a more restrained fair value estimate.
If you want to see how these viewpoints extend into full storylines, including detailed assumptions, risks and valuation logic, you can step through the complete Narratives on Simply Wall St and test which one lines up more closely with your own thesis on Kosmos Energy.
Do you think there's more to the story for Kosmos Energy? Head over to our Community to see what others are saying!

This article by Simply Wall St is general in nature. We provide commentary based on historical data and analyst forecasts only using an unbiased methodology and our articles are not intended to be financial advice. It does not constitute a recommendation to buy or sell any stock, and does not take account of your objectives, or your financial situation. We aim to bring you long-term focused analysis driven by fundamental data. Note that our analysis may not factor in the latest price-sensitive company announcements or qualitative material. Simply Wall St has no position in any stocks mentioned.