Is It Too Late To Consider Merck (MRK) After A 56.5% One Year Rally?
Merck & Co., Inc. MRK | 0.00 |
- Evaluating whether Merck at around US$115 per share still offers value, or whether most of the opportunity is already priced in, starts with understanding what the current market price actually reflects.
- The stock has pulled back about 5.9% over the past week, but is still up 2.7% over the last 30 days, 8.2% year to date, and 56.5% over the past year. This naturally raises questions about how much risk and upside are now incorporated into the price.
- Recent coverage has focused on Merck's positioning within large pharmaceuticals and how its pipeline, product mix, and capital allocation choices shape expectations. This helps explain why the stock has attracted fresh attention. These stories give important context for the recent share price moves, even if they do not always address whether the stock now looks expensive or reasonably priced.
- On Simply Wall St's valuation checks, Merck currently scores 3 out of 6. The next sections will walk through the key valuation methods behind that score and then finish with a way of thinking about value that goes beyond any single model.
Approach 1: Merck Discounted Cash Flow (DCF) Analysis
A Discounted Cash Flow model projects a company’s future cash flows and then discounts them back to today. This aims to estimate what the business might be worth based on those projected dollars rather than current earnings multiples.
For Merck, the model used is a 2 Stage Free Cash Flow to Equity approach, based on cash flow projections in US$. The latest twelve month free cash flow sits at about $14.0b. Analyst inputs cover the early years. Simply Wall St then extrapolates further out, including a projected free cash flow of $24.6b in 2030. Intermediate projections for 2026 to 2035 range from roughly $11.7b to $27.5b before discounting, with each year’s figure reduced back to today’s value using a required return.
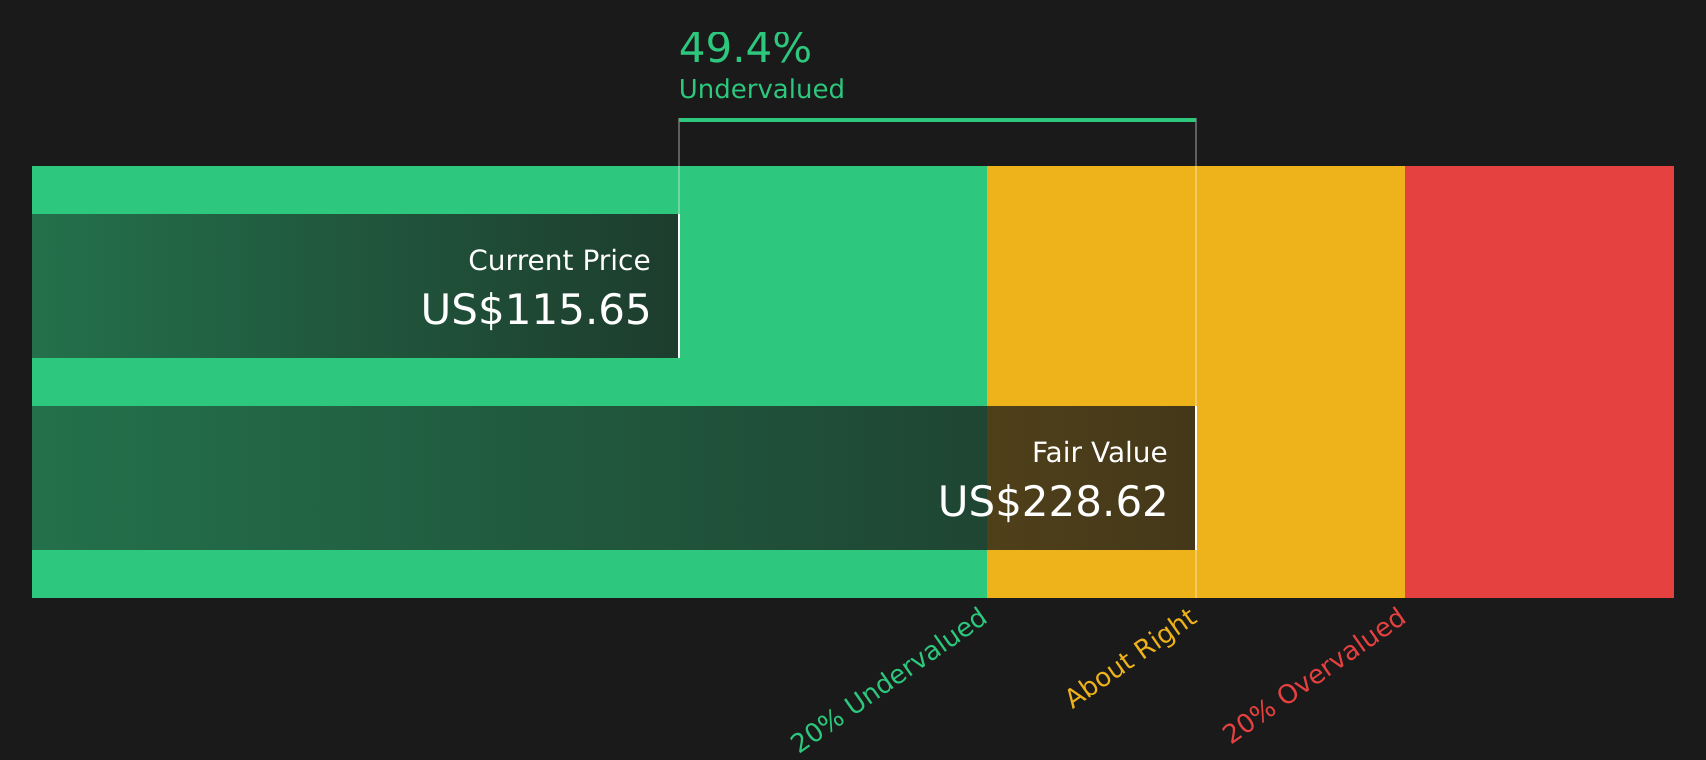
Pulling this together, the DCF output suggests an estimated intrinsic value of about $228.62 per share. Compared with the current price of around $115, the model points to roughly a 49.6% discount, which implies the stock screens as undervalued on this cash flow view.
Result: UNDERVALUED
Our Discounted Cash Flow (DCF) analysis suggests Merck is undervalued by 49.6%. Track this in your watchlist or portfolio, or discover 47 more high quality undervalued stocks.
Approach 2: Merck Price vs Earnings
For a profitable company like Merck, the P/E ratio is a useful way to relate what you pay for the stock to the earnings it generates per share. It helps you see how many dollars of price investors are currently willing to pay for each dollar of earnings.
What counts as a “normal” or “fair” P/E depends on how the market views a company’s growth potential and risk profile. Higher expected growth and lower perceived risk can support a higher P/E, while slower growth or higher risk usually call for a lower one.
Merck currently trades on a P/E of about 31.84x. This is above the Pharmaceuticals industry average of 15.36x and also above the peer group average of 24.68x. Simply Wall St’s Fair Ratio for Merck is 33.38x. This Fair Ratio is a proprietary estimate of what the P/E might be, given factors such as earnings growth, industry, profit margin, market cap and risks. Because it incorporates these fundamentals, it is more tailored than a simple comparison with industry or peer averages.
Comparing Merck’s actual P/E of 31.84x with the Fair Ratio of 33.38x indicates that the stock screens as slightly undervalued on this metric.
Result: UNDERVALUED

P/E ratios tell one story, but what if the real opportunity lies elsewhere? Start investing in legacies, not executives. Discover our 20 top founder-led companies.
Upgrade Your Decision Making: Choose your Merck Narrative
Earlier it was mentioned that there is an even better way to think about valuation. This is where Narratives come in, giving you a simple way to attach a story about Merck to the numbers such as your fair value, and your assumptions for future revenue, earnings and margins. You can then link that story to a financial forecast and a price you think is reasonable, all within Simply Wall St’s Community page. There, millions of investors can compare Fair Value to the current price, watch those Narratives update as fresh news or earnings arrive, and see, for example, how one Merck Narrative might point to a Fair Value of about US$150.0 while another sits closer to US$101.3. This reflects very different views on how the business could play out and what that might mean for whether the stock looks attractive or fully priced to you today.
For Merck however we will make it really easy for you with previews of two leading Merck Narratives:
Fair value in this bullish narrative: US$150.00 per share.
At a last close of US$115.17, this view implies Merck trades at about 23.2% below that fair value estimate.
Revenue growth assumption: 6.8% a year.
- Analysts backing this view see more than US$80.1b of revenue and US$30.8b of earnings by 2029, with profit margins rising from 13.6% to 38.4%.
- They assume Merck earns that outcome partly by funding a broad pipeline, including more than 20 potential blockbusters across oncology, vaccines, and chronic disease treatments.
- Key risks in this story include heavy reliance on Keytruda, pricing pressure from regulators, and the chance that pipeline assets or R&D spending do not translate into the expected earnings power.
Fair value in this bearish narrative: about US$101.30 per share.
At a last close of US$115.17, this view implies Merck trades about 13.7% above that fair value estimate.
Revenue growth assumption: 3.1% a year.
- Analysts behind this view expect more modest progress, with revenue reaching about US$71.3b and earnings of US$20.4b by 2029, and profit margins nudging from 28.1% to 28.7%.
- They focus on risks around Keytruda loss of exclusivity, pricing pressure, biosimilar and generic competition, and the possibility that acquisitions like Terns and potential large deals do not deliver enough earnings to justify their cost.
- This camp still recognises Merck's late stage pipeline and acquisitions as potential supports, but sees current market expectations as full, which leaves less room if execution on M&A and new launches is slower or more costly than hoped.
Taken together, these Narratives show how reasonable analysts can look at the same DCF output, P/E multiples, and product pipeline and reach very different conclusions about whether Merck around US$115 per share looks attractively priced or already demanding.
If you want to see how these stories evolve as new data, deals, and guidance land, the easiest way is to follow the full set of Community Narratives, compare their fair values to the latest price, and track which assumptions line up most closely with your own view of the stock.
To see how these results tie into long-term growth, risks, and valuation, check out the full range of community narratives for Merck on Simply Wall St. Add the company to your watchlist or portfolio so you'll be alerted when the story evolves.
Do you think there's more to the story for Merck? Head over to our Community to see what others are saying!

This article by Simply Wall St is general in nature. We provide commentary based on historical data and analyst forecasts only using an unbiased methodology and our articles are not intended to be financial advice. It does not constitute a recommendation to buy or sell any stock, and does not take account of your objectives, or your financial situation. We aim to bring you long-term focused analysis driven by fundamental data. Note that our analysis may not factor in the latest price-sensitive company announcements or qualitative material. Simply Wall St has no position in any stocks mentioned.