Is It Too Late To Consider MKS Instruments (MKSI) After The Recent Share Price Surge?
MKS Inc. MKSI | 234.66 | -0.55% |
- If you are wondering whether MKS at around US$250.60 is still a reasonable entry or more of a hold, you are asking the right question for a stock that has already moved a lot.
- The share price has seen strong recent returns, with about 9.2% over the past week, 34.7% over the past month, 48.8% year to date, 128.4% over the last year, 158.0% over three years and 51.3% over five years, which can change how the market views both its potential and its risks.
- Recent company specific news and sector commentary help explain why sentiment around MKS has shifted, giving more context to these returns. For anyone considering the stock today, those developments matter because they help frame whether the current price reflects short term enthusiasm or something more durable.
- Despite this share price history, MKS currently has a valuation score of 0 out of 6. Next we will look at how different valuation methods treat the stock and then finish with a way to think about valuation that can tie all of those pieces together.
MKS scores just 0/6 on our valuation checks. See what other red flags we found in the full valuation breakdown.
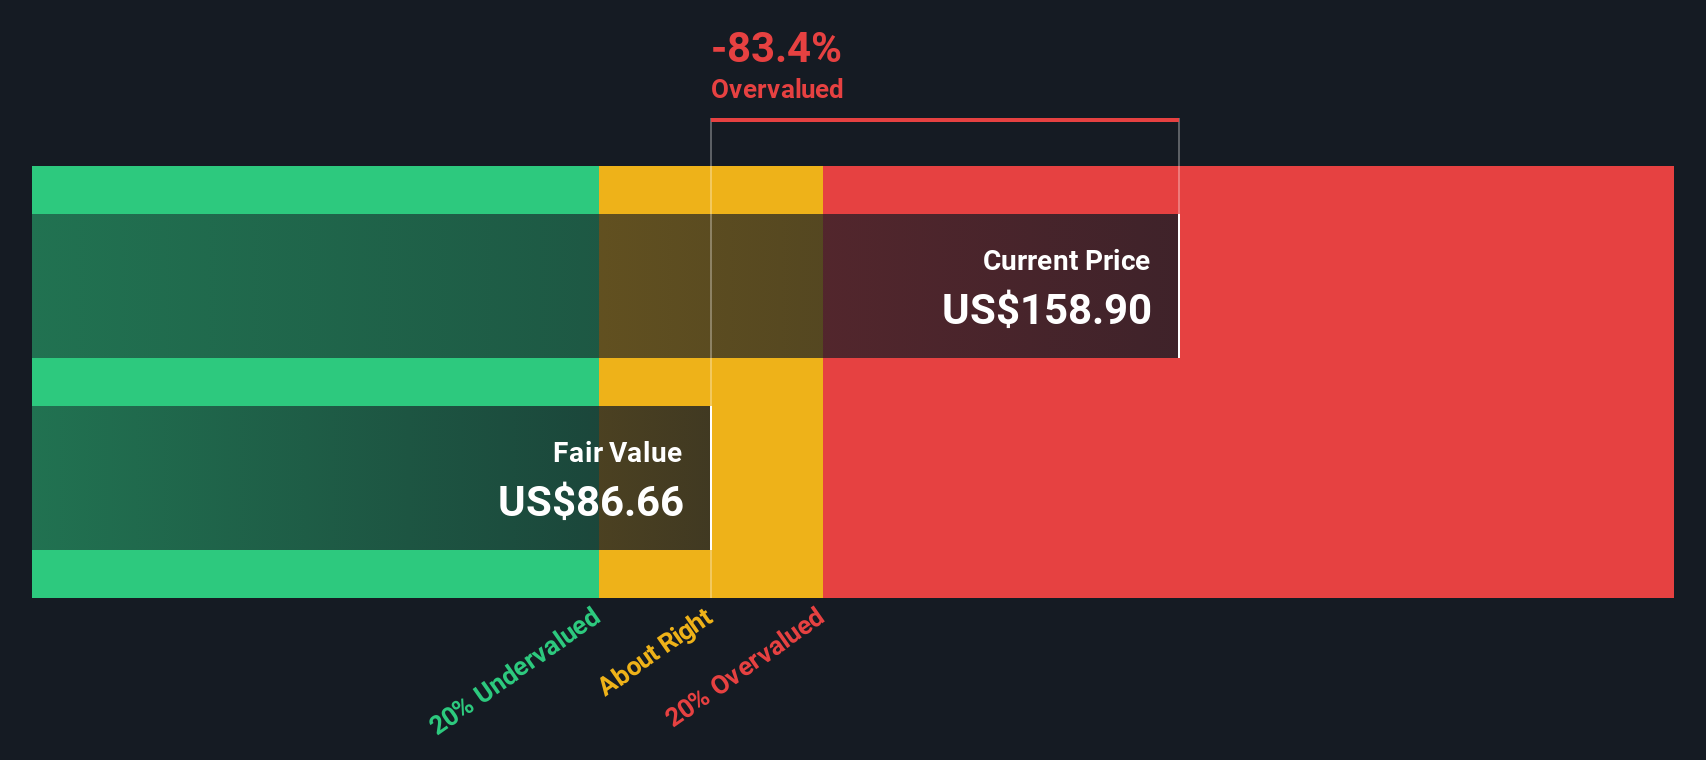
Approach 1: MKS Discounted Cash Flow (DCF) Analysis
A Discounted Cash Flow, or DCF, model takes a company’s expected future cash flows and discounts them back to today using a required rate of return. The idea is simple: what matters is not just how much cash MKS might generate, but what that stream of cash is worth in today’s dollars.
For MKS, the model used is a 2 Stage Free Cash Flow to Equity approach. The latest twelve month Free Cash Flow is about $556.4 million. Analysts provide explicit forecasts out to 2027, with Free Cash Flow projected at $708.4 million. Beyond that, Simply Wall St extrapolates out to 2035, with discounted annual Free Cash Flow figures in the model ranging from about $415.9 million to $360.7 million over the next decade.
Bringing all of those projected cash flows back to today, the DCF model arrives at an estimated intrinsic value of about $137.27 per share, compared with the current share price of around $250.60. On this basis, MKS screens as roughly 82.6% above the model’s estimate of fair value, which points to a rich valuation on cash flow assumptions alone.
Result: OVERVALUED
Our Discounted Cash Flow (DCF) analysis suggests MKS may be overvalued by 82.6%. Discover 52 high quality undervalued stocks or create your own screener to find better value opportunities.
Approach 2: MKS Price vs Earnings
For profitable companies like MKS, the P/E ratio is a common way to think about what you are paying for each dollar of earnings. A higher P/E usually reflects higher growth expectations or lower perceived risk, while a lower P/E often points to more modest growth expectations or higher risk.
MKS currently trades on a P/E of about 60.33x. That sits above both the Semiconductor industry average of roughly 44.17x and the peer average of about 47.50x, so on simple comparisons the shares look expensive relative to many similar businesses.
Simply Wall St’s Fair Ratio for MKS is 43.97x. This is a proprietary estimate of what a more normal P/E might look like for the company, given factors such as its earnings growth profile, margins, industry, market cap and risk characteristics. This Fair Ratio can be more useful than a plain peer or industry comparison because it tries to adjust for MKS’s own mix of growth, profitability, size and risk, rather than assuming all companies should trade on the same multiple.
With the current P/E of 60.33x sitting above the Fair Ratio of 43.97x, MKS screens as expensive on this earnings based yardstick.
Result: OVERVALUED

P/E ratios tell one story, but what if the real opportunity lies elsewhere? Start investing in legacies, not executives. Discover our 22 top founder-led companies.
Upgrade Your Decision Making: Choose your MKS Narrative
Earlier we mentioned that there is an even better way to understand valuation, and on Simply Wall St that takes the form of Narratives. These let you attach a clear story about MKS to specific assumptions for future revenue, earnings and margins, link that story to a financial forecast and fair value, and then compare that fair value with today’s price. All of this happens inside an accessible tool on the Community page that updates automatically when new earnings or news arrive. You can then see, for example, how one investor framing MKS around a lower fair value of about US$92 with more cautious growth assumptions can sit alongside another who sees a fair value closer to US$200 with stronger growth and profitability in mind. This gives you a structured way to decide whether the current share price near US$250.60 looks high, low or about right for the Narrative you actually believe.
Do you think there's more to the story for MKS? Head over to our Community to see what others are saying!

This article by Simply Wall St is general in nature. We provide commentary based on historical data and analyst forecasts only using an unbiased methodology and our articles are not intended to be financial advice. It does not constitute a recommendation to buy or sell any stock, and does not take account of your objectives, or your financial situation. We aim to bring you long-term focused analysis driven by fundamental data. Note that our analysis may not factor in the latest price-sensitive company announcements or qualitative material. Simply Wall St has no position in any stocks mentioned.