Is It Too Late To Consider MYR Group (MYRG) After A 206% One-Year Surge?
MYR Group Inc. MYRG | 0.00 |
- If you are wondering whether MYR Group at around US$468.54 is offering value after such a strong run, or if you are late to the story, this article focuses squarely on what the numbers say about the stock's price.
- The share price has moved sharply, with returns of 41.6% over the past week, 64.0% over the past month, 106.7% year to date and 206.4% over the past year, which has naturally sharpened interest in what is now priced in.
- Recent coverage has centered on MYR Group's role as a construction and infrastructure contractor in the capital goods space, as investors assess how its project pipeline and sector positioning relate to the current share price. Broader commentary has also focused on the stock's strong multi year return profile of 249.0% over three years and 484.3% over five years, providing context for today's valuation debate.
- Even with this track record, MYR Group currently has a valuation score of 0 out of 6. The sections that follow will compare different valuation approaches, then finish with a way to think about value that goes beyond any single model.
MYR Group scores just 0/6 on our valuation checks. See what other red flags we found in the full valuation breakdown.
Approach 1: MYR Group Discounted Cash Flow (DCF) Analysis
Approach 1: MYR Group Discounted Cash Flow (DCF) Analysis
A Discounted Cash Flow model takes projected future cash flows and then discounts them back to today using a required return to estimate what those future dollars are worth in the present.
For MYR Group, the model uses a 2 stage Free Cash Flow to Equity approach. The latest twelve month free cash flow is $239.38 million. Analysts and extrapolated estimates feed into a cash flow path that includes projected free cash flow of $383.00 million in 2030, with interim annual figures such as $194.90 million in 2026 and $218.50 million in 2027. Beyond the explicit analyst years, Simply Wall St extrapolates further free cash flow out to 2035 based on the earlier pattern.
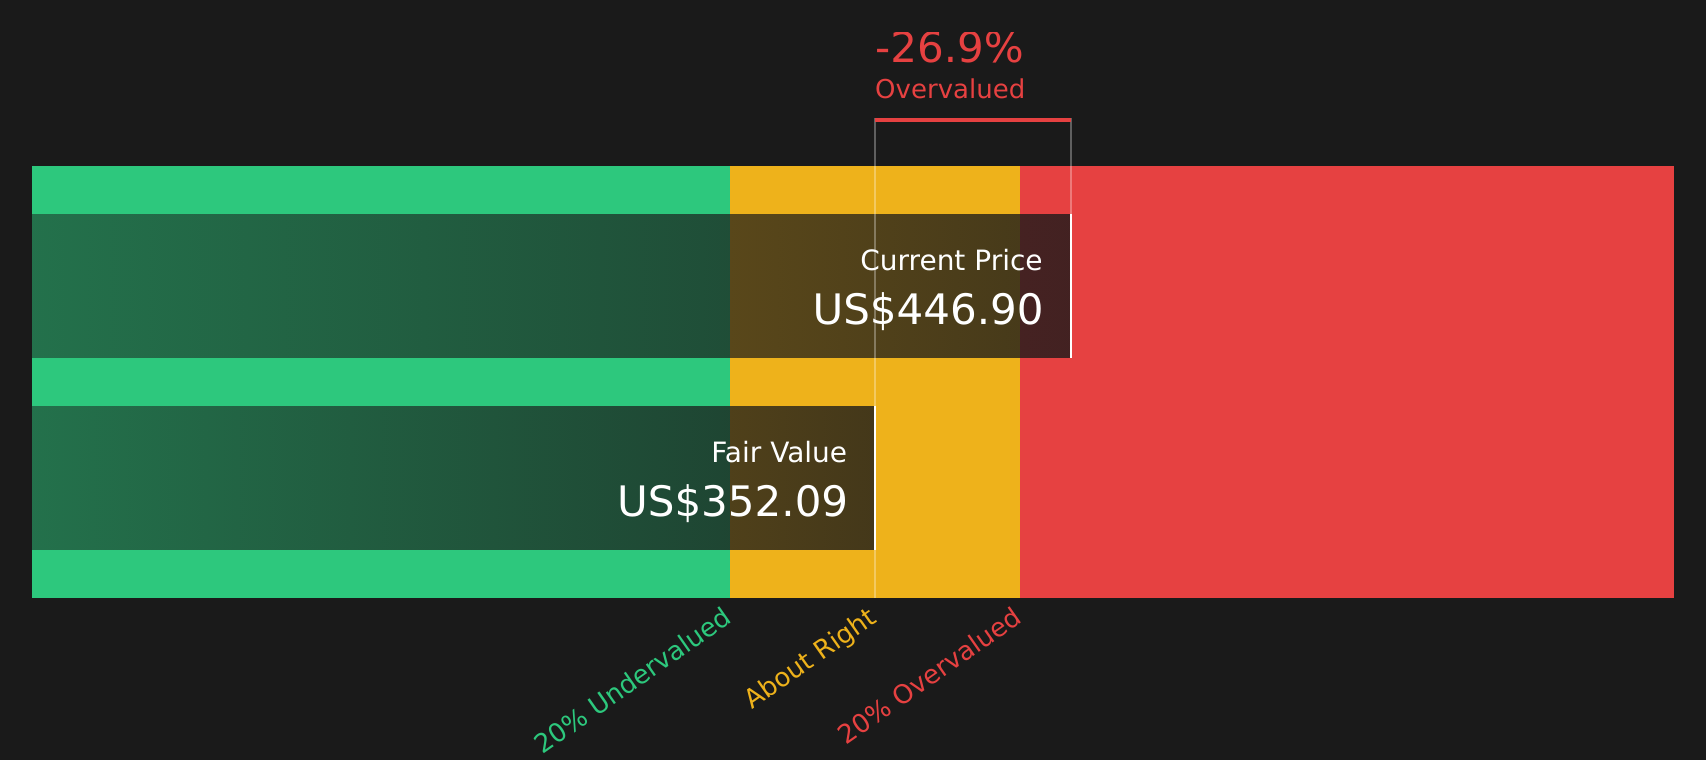
When all these projected cash flows are discounted back and summed, the resulting intrinsic value comes out at $414.05 per share. Compared with the current share price of about $468.54, the DCF output suggests MYR Group is around 13.2% overvalued on this model.
Result: OVERVALUED
Our Discounted Cash Flow (DCF) analysis suggests MYR Group may be overvalued by 13.2%. Discover 51 high quality undervalued stocks or create your own screener to find better value opportunities.
Approach 2: MYR Group Price vs Earnings
For profitable companies, the P/E ratio is a straightforward way to link what you pay for each share to the earnings that support that price. A higher or lower P/E often reflects what the market is factoring in about future growth and the risk that those earnings might not materialize or could be volatile.
MYR Group currently trades on a P/E of 51.41x. That sits above the Construction industry average P/E of 48.21x and above the peer group average of 35.09x, which points to the market assigning a richer earnings multiple to this stock than to many of its sector peers.
Simply Wall St’s Fair Ratio for MYR Group is 29.17x. This is a proprietary estimate of what a reasonable P/E might be for the stock, based on factors such as its earnings growth profile, industry, profit margins, market cap and key risks. Because it is tailored to the company’s own fundamentals rather than just broad sector comparisons, the Fair Ratio can give a more targeted sense of whether the current P/E is stretched or conservative. With the actual P/E of 51.41x sitting well above the Fair Ratio of 29.17x, the multiple based view suggests the stock is pricing in a lot.
Result: OVERVALUED

P/E ratios tell one story, but what if the real opportunity lies elsewhere? Start investing in legacies, not executives. Discover our 19 top founder-led companies.
Upgrade Your Decision Making: Choose your MYR Group Narrative
Earlier it was mentioned that there is an even better way to understand valuation, so Narratives on Simply Wall St let you attach a clear story about MYR Group to your numbers by linking your view of its projects, margins and risks to a simple financial forecast that produces a Fair Value you can compare directly with today’s price, update automatically when new earnings or news arrive, and benchmark against other investors’ views such as a cautious scenario closer to US$295 or a more optimistic view near US$450. All of this is available within the Community page used by millions of investors, so you can quickly see whether your own Narrative suggests MYR Group looks expensive, cheap or fairly priced to you.
Do you think there's more to the story for MYR Group? Head over to our Community to see what others are saying!

This article by Simply Wall St is general in nature. We provide commentary based on historical data and analyst forecasts only using an unbiased methodology and our articles are not intended to be financial advice. It does not constitute a recommendation to buy or sell any stock, and does not take account of your objectives, or your financial situation. We aim to bring you long-term focused analysis driven by fundamental data. Note that our analysis may not factor in the latest price-sensitive company announcements or qualitative material. Simply Wall St has no position in any stocks mentioned.