Is It Too Late To Consider Newmont (NEM) After A 169% One Year Surge?
Newmont Corporation NEM | 113.41 | +0.33% |
- If you are wondering whether Newmont shares still offer value after a strong run, this article will walk through what the current price could mean for long term investors.
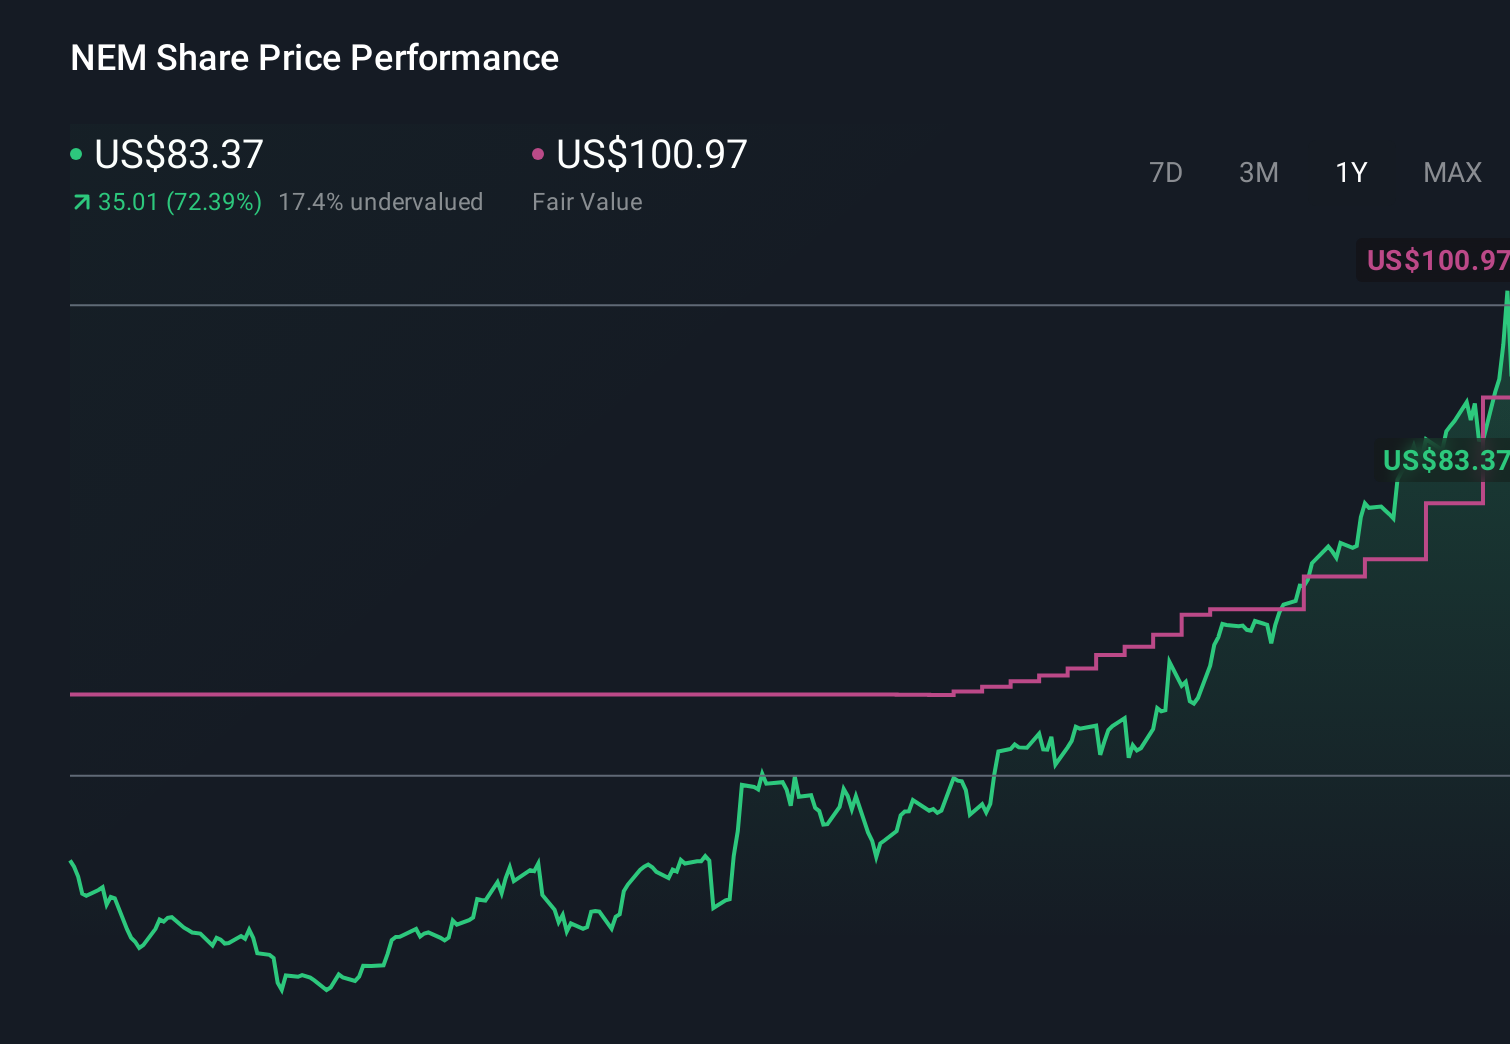
- Newmont's share price recently closed at US$125.80, with returns of 3.5% over the last 7 days, 10.2% over 30 days, 24.3% year to date and 169.3% over the last year, as well as 202.0% over 3 years and 159.2% over 5 years.
- Recent coverage of Newmont has focused on its position as a major gold producer and its scale in the materials sector, which can affect how investors think about the stock's risk profile and sensitivity to commodity prices. Broader industry commentary has also highlighted how large, established miners can react to changes in sentiment toward precious metals and capital intensive projects.
- On our valuation checks, Newmont currently scores 3 out of 6. Next, we will look at what different valuation methods suggest about that score and hint at an even better way to think about valuation later in the article.
Approach 1: Newmont Discounted Cash Flow (DCF) Analysis
A Discounted Cash Flow model estimates what a company might be worth by projecting its future cash flows and then discounting those back to what they could be worth today.
For Newmont, the model used is a 2 Stage Free Cash Flow to Equity approach, based on cash flow projections. The latest twelve month free cash flow is about $5.34b. Analyst estimates feed into near term projections, and Simply Wall St then extrapolates further out, including a forecast free cash flow of $7.66b in 2029. Across the ten year projection window, forecast free cash flows generally sit in the $7b to $10b range, all expressed in US$ and then discounted back to today.
On this basis, the DCF model arrives at an estimated intrinsic value of about $121.29 per share, compared with the recent share price of $125.80. That implies Newmont trades at roughly a 3.7% premium to this DCF estimate, which is a relatively small gap and suggests the market price is quite close to this model’s assessment.
Result: ABOUT RIGHT
Newmont is fairly valued according to our Discounted Cash Flow (DCF), but this can change at a moment's notice. Track the value in your watchlist or portfolio and be alerted on when to act.

Approach 2: Newmont Price vs Earnings
For a profitable company like Newmont, the P/E ratio is a useful way to think about value because it links what you are paying directly to the earnings the business is generating today.
What counts as a “normal” P/E depends on how fast earnings are expected to grow and how risky those earnings are. Higher expected growth or lower perceived risk can justify a higher P/E, while slower growth or higher risk usually goes with a lower multiple.
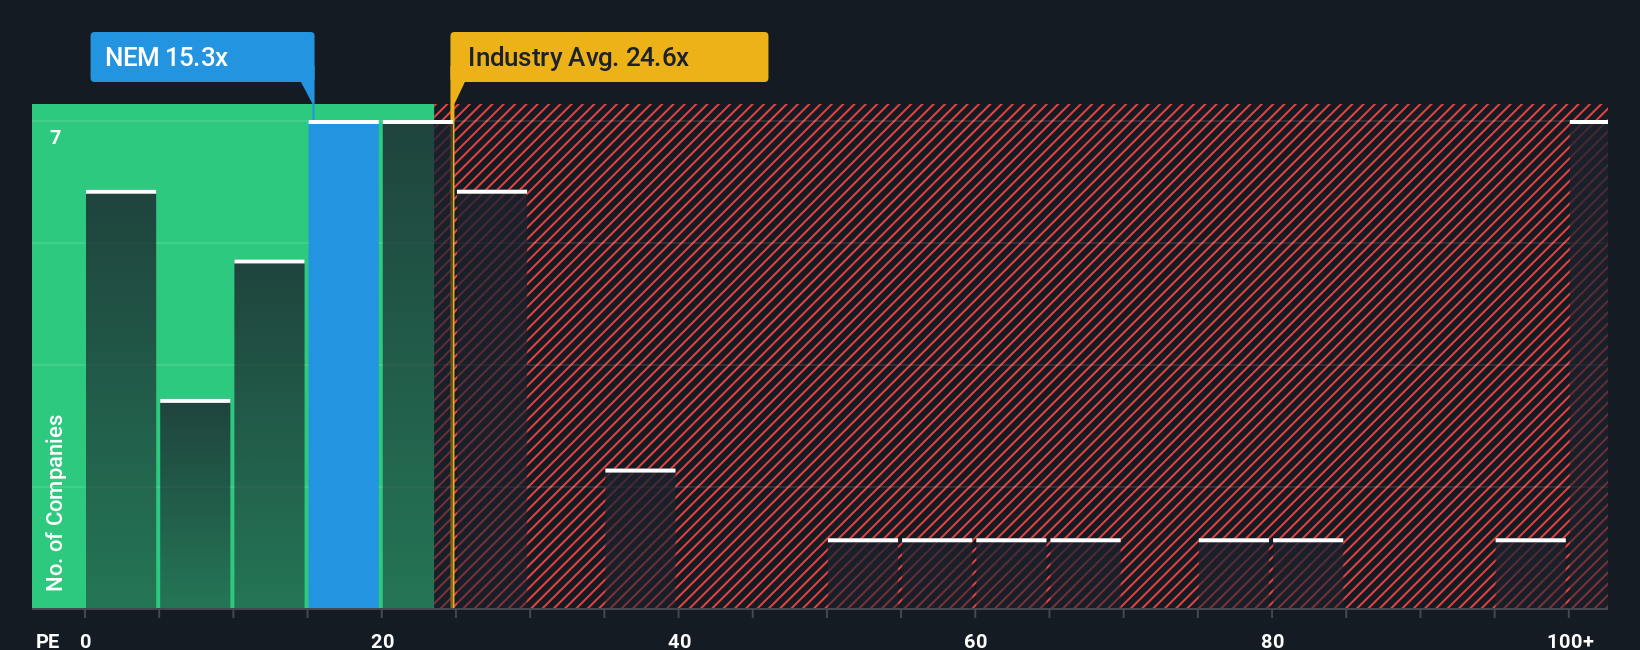
Newmont currently trades on a P/E of 19.05x. That sits below the Metals and Mining industry average P/E of about 25.28x and also below the peer group average of 33.61x. Simply Wall St’s Fair Ratio for Newmont is 28.58x, which is their view of a more fitting P/E once you factor in its earnings profile, industry, margins, size and risk characteristics.
The Fair Ratio is more tailored than a simple peer or industry comparison because it accounts for company specific growth, profitability, risk factors and market cap, rather than assuming that all miners deserve the same multiple.
With Newmont’s actual P/E of 19.05x sitting below the Fair Ratio of 28.58x, this framework suggests that the shares may be undervalued on an earnings basis.
Result: UNDERVALUED
P/E ratios tell one story, but what if the real opportunity lies elsewhere? Start investing in legacies, not executives. Discover our 23 top founder-led companies.
Upgrade Your Decision Making: Choose your Newmont Narrative
Earlier we mentioned that there is an even better way to understand valuation, so let us introduce you to Narratives. With Narratives, you combine your story about Newmont with your own fair value, revenue, earnings and margin assumptions. You then link that story to a financial forecast and a fair value, and track it easily on Simply Wall St’s Community page, which is used by millions of investors.
In practice, Narratives can support your decision making by constantly comparing your fair value estimate to the current share price and updating that view when fresh information like news or earnings arrives. This way, any decision to buy, hold or sell is always tied back to a live, quantified thesis rather than a static number.
For example, one Newmont Narrative on the platform might lean optimistic with a fair value of about US$176.95, while another is more cautious with a fair value closer to US$58.00. By seeing these side by side, you can quickly see where your own expectations sit on that spectrum and what would need to change in the real world for your story, and your fair value, to adjust.
For Newmont however, here are previews of two leading Newmont Narratives to make comparison easier:
One leans bullish and sees Newmont as materially undervalued at the recent price. The other is more restrained and treats the current price as rich compared to its fair value estimate. Looking at both side by side can help you decide which storyline feels closer to your own view.
Fair value: US$176.95 per share
Implied discount to this fair value: about 29.0% compared to the last close of US$125.80
Revenue growth assumption: 13.57%
- Frames Newmont as a concentrated, low cost producer after a planned exit from higher cost mines, with investors watching for progress updates around the so called Tier 1 asset focus and merger synergies.
- Links Newmont closely to higher gold prices in early 2026 and highlights the sensitivity of free cash flow to moves in the gold price, especially with the combined Newcrest portfolio.
- Views the current share price as below an estimated intrinsic value floor, with attention on how capital returns, project delivery and cost outcomes could affect the gap between price and this fair value estimate.
Fair value: US$110.65 per share
Implied premium to this fair value: about 13.7% compared to the last close of US$125.80
Revenue growth assumption: 7.91%
- Assumes modest revenue growth and relatively stable margins, with the current share price sitting above an updated fair value that already factors in production, cash flow and capital management assumptions.
- Flags operational, cost and asset quality risks, along with reliance on divestments and leadership changes, as possible headwinds for future earnings reliability and cash generation.
- Highlights that analyst targets cluster close to the current share price, which suggests limited upside based on these assumptions and underlines the importance of checking whether you agree with the revenue, margin and P/E inputs used.
Taken together, these Narratives show how two groups of investors can look at the same Newmont data, apply different assumptions and reach very different conclusions on fair value and risk. The key for you is to decide which inputs feel more realistic and whether the current price compensates you for the uncertainties you care about most.
Do you think there's more to the story for Newmont? Head over to our Community to see what others are saying!
This article by Simply Wall St is general in nature. We provide commentary based on historical data and analyst forecasts only using an unbiased methodology and our articles are not intended to be financial advice. It does not constitute a recommendation to buy or sell any stock, and does not take account of your objectives, or your financial situation. We aim to bring you long-term focused analysis driven by fundamental data. Note that our analysis may not factor in the latest price-sensitive company announcements or qualitative material. Simply Wall St has no position in any stocks mentioned.