Is It Too Late To Consider Royal Caribbean Cruises (RCL) After Its Strong Multi‑Year Rally?
Royal Caribbean Group RCL | 273.59 | -3.00% |
- If you are wondering whether Royal Caribbean Cruises is still offering value after its big run, you are not alone. This article focuses squarely on what you are paying for the business today.
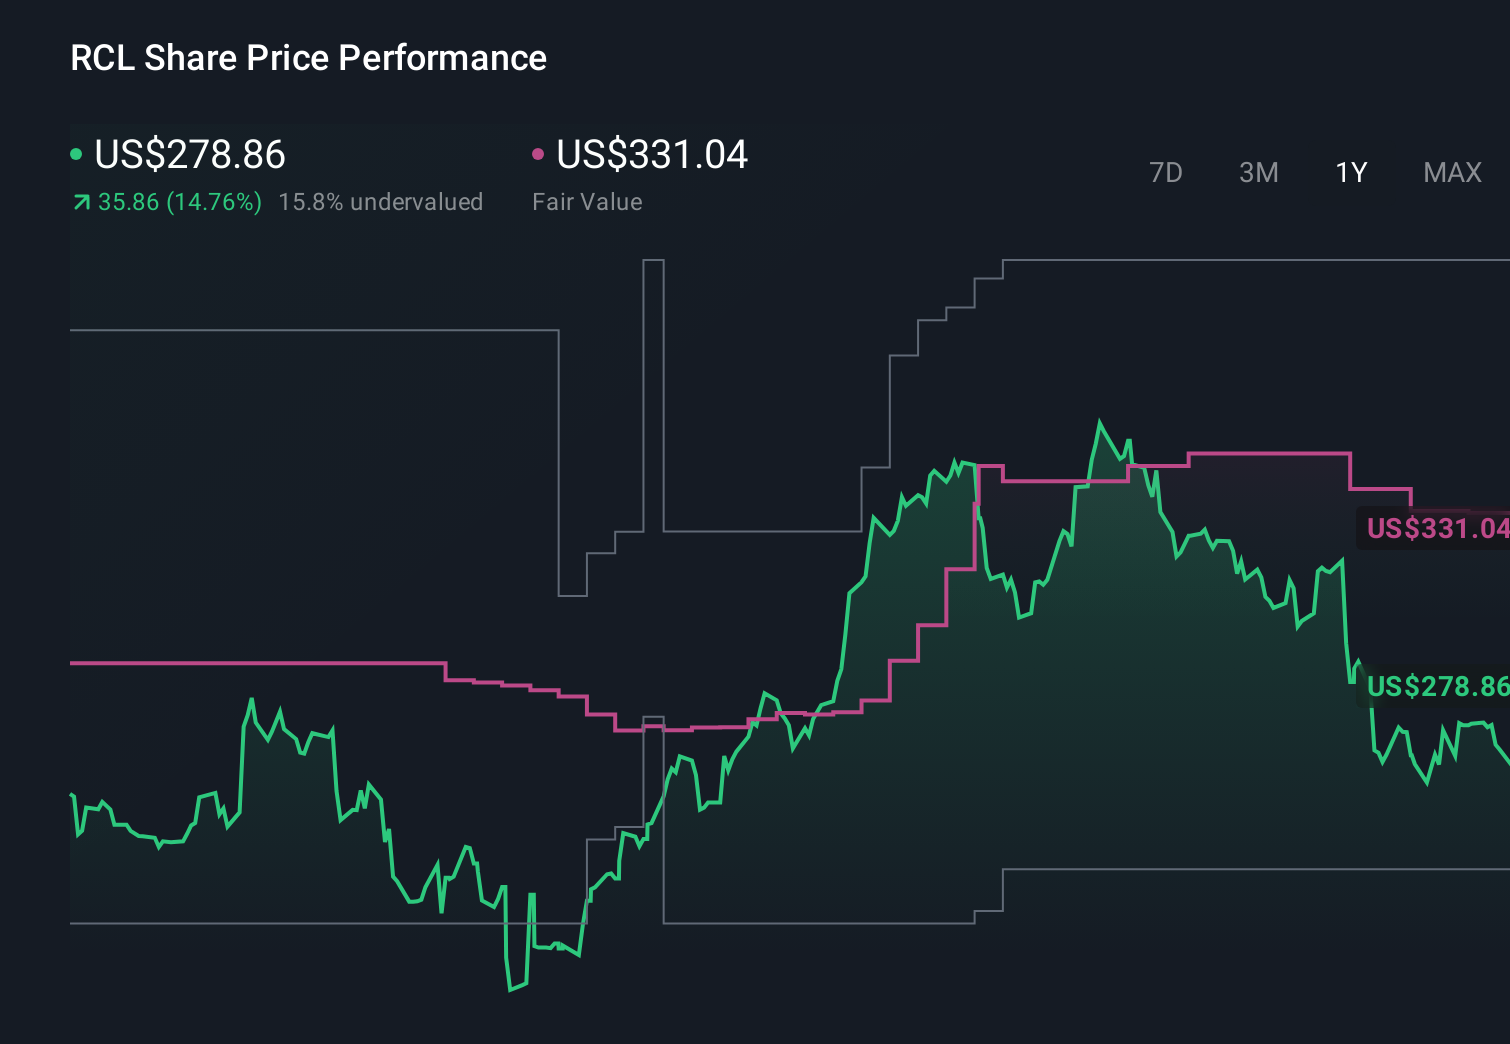
- The stock last closed at US$324.65, with returns of 13.5% over 7 days, 14.6% over 30 days, 14.6% year to date, 23.3% over 1 year, and very large gains over 3 and 5 years that signal a major shift in how the market is pricing the company.
- These moves have been set against ongoing interest in the cruise sector, including headlines around capacity growth, demand trends, and the broader recovery in leisure travel, which continue to shape how investors think about cruise operators. For Royal Caribbean Cruises specifically, recent coverage has focused on its position within that recovery story and how resilient bookings and pricing could be, which helps explain why the market is paying close attention to the stock.
- Right now, Royal Caribbean Cruises has a valuation score of 5 / 6. Next, we will walk through what that means using several valuation approaches, before finishing with a way of looking at value that ties the numbers back to the bigger picture.
Approach 1: Royal Caribbean Cruises Discounted Cash Flow (DCF) Analysis
A Discounted Cash Flow, or DCF, model estimates what a business could be worth today by projecting its future cash flows and discounting them back to the present using a required return.
For Royal Caribbean Cruises, the model used here is a 2 Stage Free Cash Flow to Equity approach based on cash flow projections. The company’s latest twelve month free cash flow is about $1.86b. Analyst estimates and subsequent extrapolations indicate free cash flow could reach $7.25b in 2029, with a full set of projections out to 2035 provided by Simply Wall St, then discounted back to today.
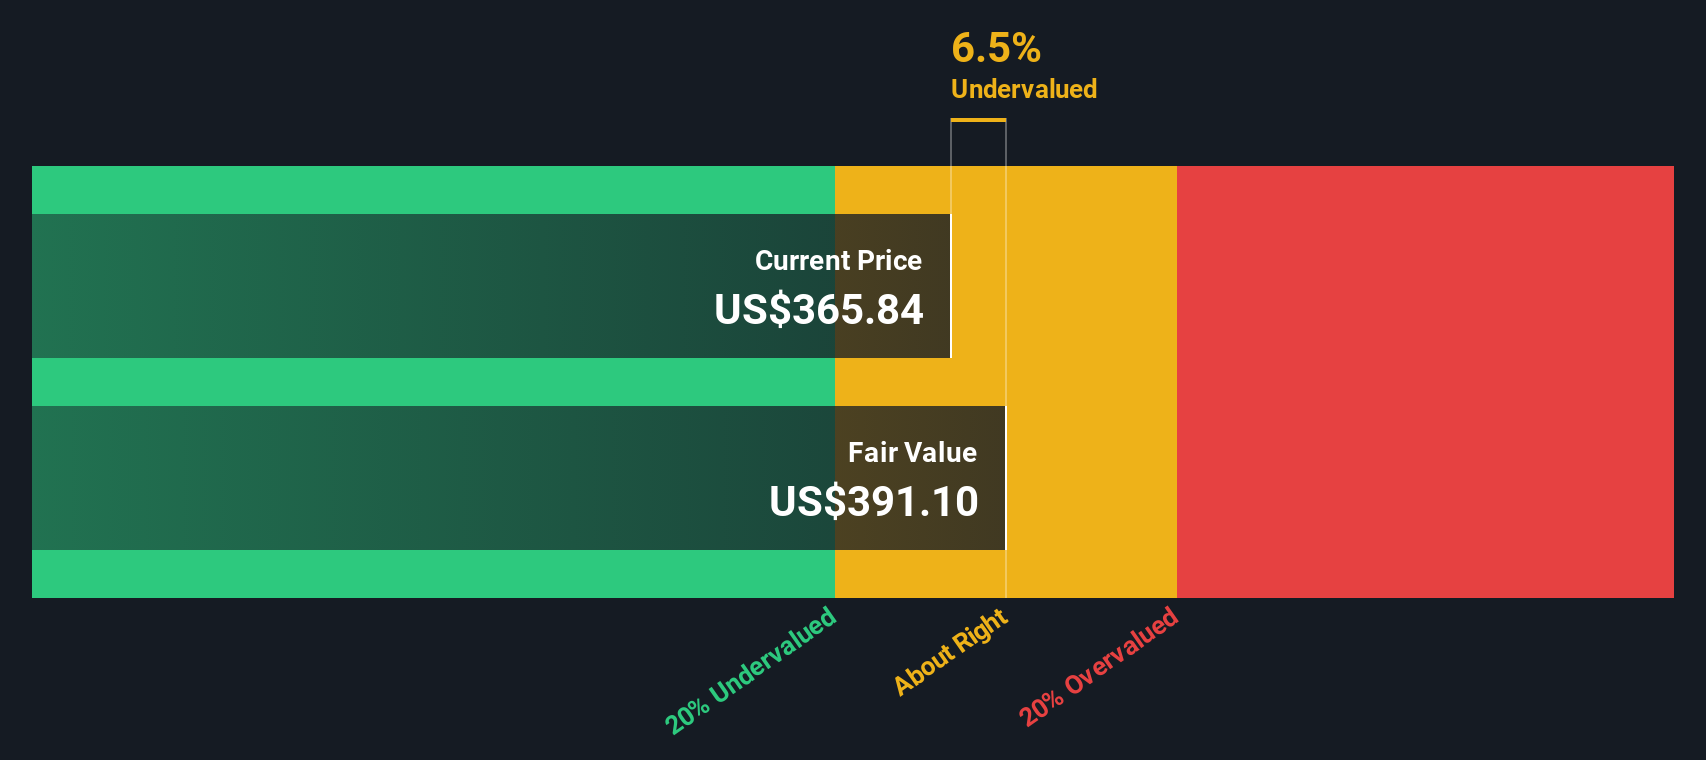
When all those discounted cash flows are added up, the model arrives at an estimated intrinsic value of about $615.53 per share. Compared with the recent share price of US$324.65, the DCF output suggests the stock is 47.3% undervalued on this set of assumptions.
Result: UNDERVALUED
Our Discounted Cash Flow (DCF) analysis suggests Royal Caribbean Cruises is undervalued by 47.3%. Track this in your watchlist or portfolio, or discover 875 more undervalued stocks based on cash flows.
Approach 2: Royal Caribbean Cruises Price vs Earnings
For a profitable company, the P/E ratio is a straightforward way to connect what you pay per share with the earnings the business is generating today. It is a quick sense check of how many dollars investors are willing to pay for each dollar of earnings.
What counts as a “normal” P/E depends on how the market views a company’s growth prospects and risk. Higher expected growth or lower perceived risk often goes with a higher P/E, while slower growth or higher risk tends to align with a lower one.
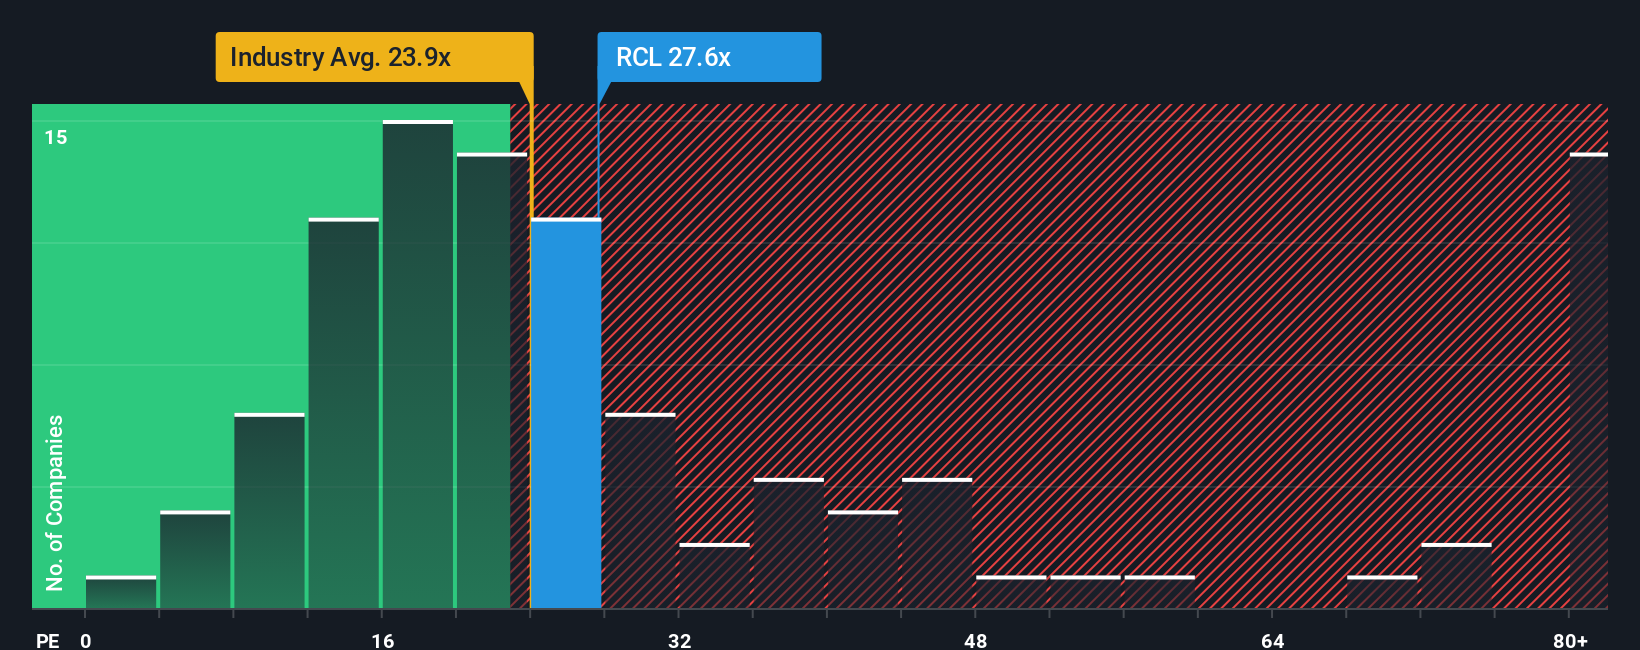
Royal Caribbean Cruises currently trades on a P/E of 20.57x. That sits close to the Hospitality industry average of 21.15x, and below the peer group average of 29.73x. Simply Wall St’s Fair Ratio for Royal Caribbean Cruises is 28.42x, which is its own estimate of a suitable P/E given the company’s earnings growth profile, industry, profit margins, market cap and risk factors. This Fair Ratio can be more informative than a simple comparison with peers or the industry because it adjusts for company specific characteristics rather than treating all operators the same.
Comparing the current P/E of 20.57x with the Fair Ratio of 28.42x suggests the shares are trading below that fair level on this metric.
Result: UNDERVALUED
P/E ratios tell one story, but what if the real opportunity lies elsewhere? Discover 1426 companies where insiders are betting big on explosive growth.
Upgrade Your Decision Making: Choose your Royal Caribbean Cruises Narrative
Earlier we mentioned that there is an even better way to understand valuation, so let us introduce you to Narratives. These are simply your own story about a company, linked directly to your numbers for fair value, future revenue, earnings and margins.
On Simply Wall St’s Community page, used by millions of investors, a Narrative lets you connect three pieces in one place: the business story you believe in, the financial forecast that flows from that story, and the fair value that results from those forecasts.
Because each Narrative compares your fair value with the current market price, it becomes a clear decision tool you can use to decide whether a stock looks attractively priced or expensive based on your view, not someone else’s.
Narratives also update automatically when new information such as earnings releases or major news is added to the platform. This means your story and valuation stay current without you having to rebuild your work each time.
For Royal Caribbean Cruises, for example, one investor might set a high fair value per share based on strong long term demand for cruising and resilient margins, while another might set a much lower fair value if they assume more modest revenue growth, tighter margins and a higher required return.
Do you think there's more to the story for Royal Caribbean Cruises? Head over to our Community to see what others are saying!
This article by Simply Wall St is general in nature. We provide commentary based on historical data and analyst forecasts only using an unbiased methodology and our articles are not intended to be financial advice. It does not constitute a recommendation to buy or sell any stock, and does not take account of your objectives, or your financial situation. We aim to bring you long-term focused analysis driven by fundamental data. Note that our analysis may not factor in the latest price-sensitive company announcements or qualitative material. Simply Wall St has no position in any stocks mentioned.