Is It Too Late To Consider Signet Jewelers (SIG) After Its 1-Year 86.6% Rally?
Signet Jewelers Limited SIG | 92.13 | -0.61% |
- If you are wondering whether Signet Jewelers at around US$97 a share still offers value, you are not alone. This article is designed to help you frame that question clearly.
- The stock has recent returns of 5.1% over 7 days, 15.0% over 30 days, 12.6% year to date and 86.6% over 1 year, which naturally raises questions about how much of the story is already reflected in the price.
- Those moves come as investors continue to focus on Signet's position as a large listed jewelry retailer and how its business mix and brand portfolio might be responding to consumer trends. Even without tying it to a single news headline, the stock's performance is keeping it on the radar for anyone following US retail names.
- On our checks, Signet scores 3 out of 6 on a simple undervaluation screen. Next we will look at how standard tools like P/E multiples and cash flow models line up with that score, before finishing with a different way to think about value that brings all of these signals together.
Approach 1: Signet Jewelers Discounted Cash Flow (DCF) Analysis
A Discounted Cash Flow, or DCF, model takes projected future cash flows, then discounts them back to today to estimate what the entire business might be worth per share.
For Signet Jewelers, the model used here is a 2 Stage Free Cash Flow to Equity approach. The company’s last twelve months free cash flow is about $587.7 million. Analyst inputs and extrapolated estimates suggest annual free cash flow in the $450 million to $640 million range over the coming decade, ending with a projected $637.2 million in 2035, with longer term figures beyond the analyst horizon generated by Simply Wall St.
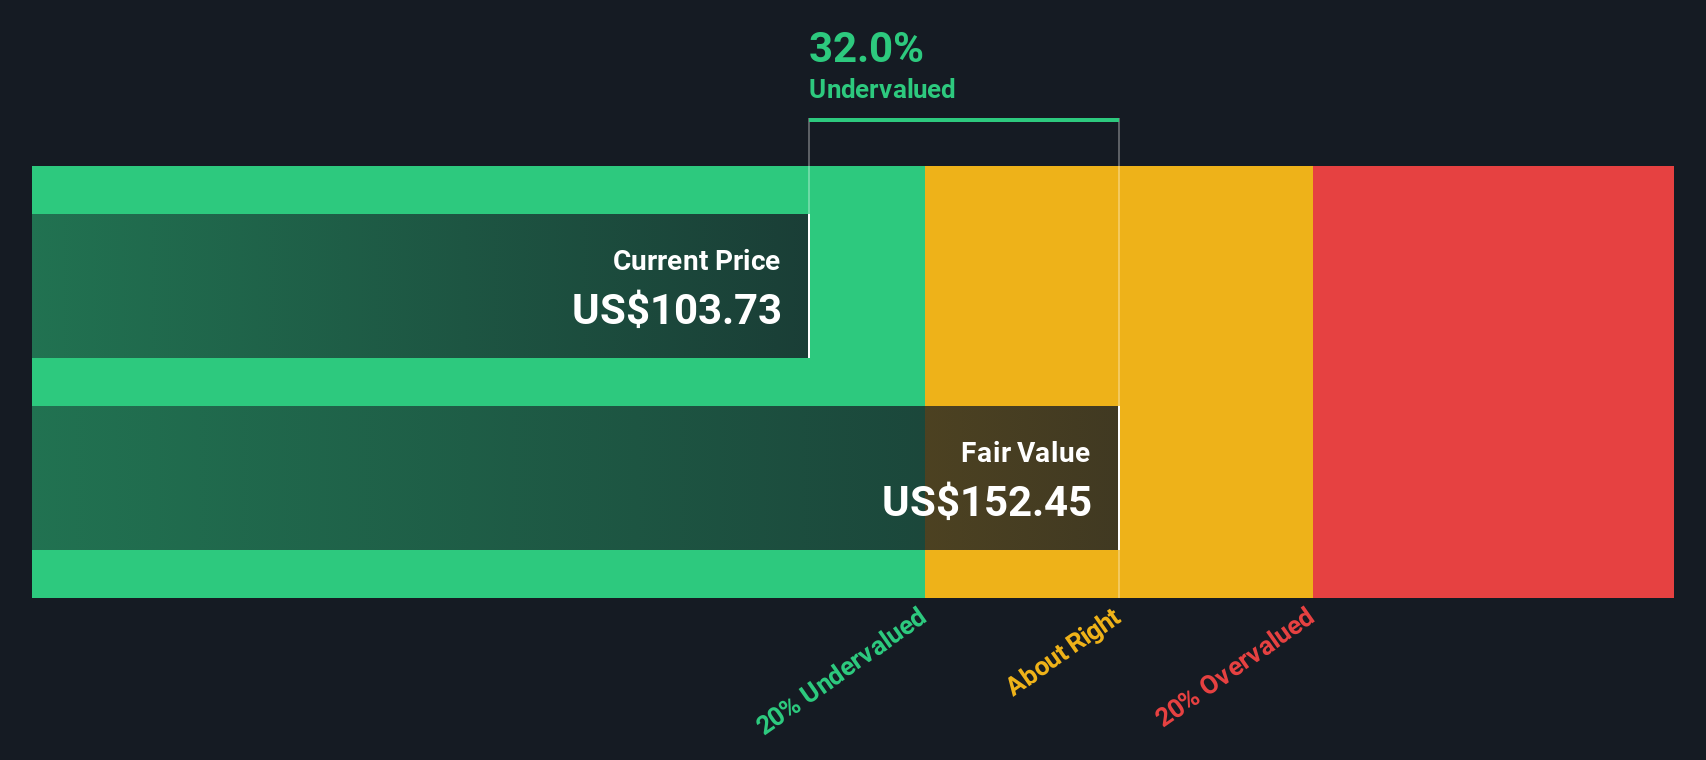
When those cash flows are discounted back and summed, the model arrives at an estimated intrinsic value of about $205.83 per share. Compared with the recent share price around US$97, this implies the shares are 52.9% below that DCF estimate, which indicates a wide valuation gap according to this model.
Result: UNDERVALUED
Our Discounted Cash Flow (DCF) analysis suggests Signet Jewelers is undervalued by 52.9%. Track this in your watchlist or portfolio, or discover 52 more high quality undervalued stocks.
Approach 2: Signet Jewelers Price vs Earnings
For a profitable business like Signet Jewelers, the P/E ratio is a useful way to connect the share price to the earnings that support it. In simple terms, it tells you how many dollars investors are currently paying for each dollar of earnings.
What counts as a “normal” P/E often reflects expectations for future growth and the level of risk investors see in the business. Higher expected growth or lower perceived risk can justify a higher P/E, while slower growth or higher risk usually points to a lower, more cautious multiple.
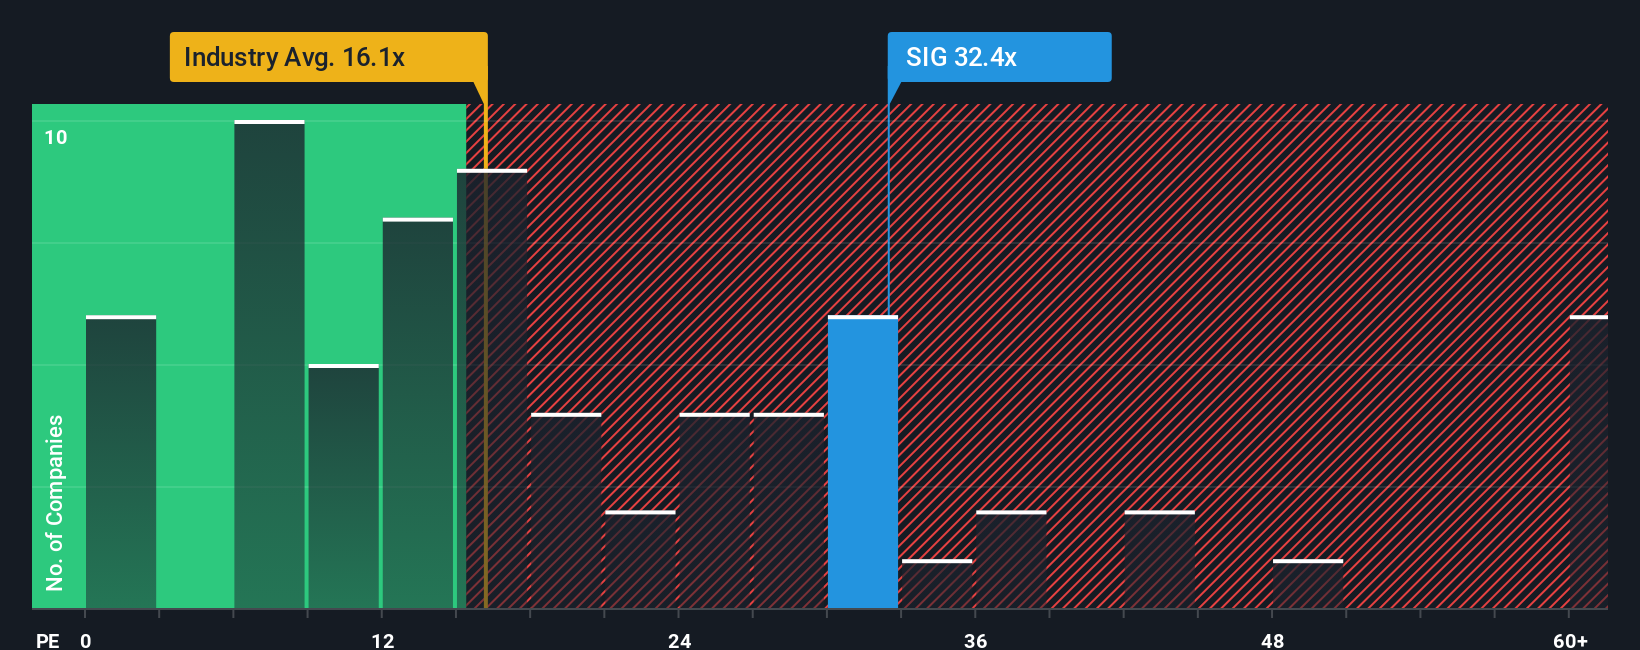
Signet trades on a P/E of about 27.2x. That sits above the Specialty Retail industry average of roughly 21.5x and also above a peer group average of about 16.1x. Simply Wall St’s Fair Ratio for Signet is around 28.4x, which is its estimate of a suitable P/E once factors like the company’s earnings profile, profit margins, industry, market cap and risk characteristics are taken into account.
The Fair Ratio is often more useful than a simple peer or industry comparison, because it adjusts for those company specific factors rather than assuming all retailers should trade on the same multiple. Here, the Fair Ratio of 28.4x is modestly above the current 27.2x P/E, which indicates that the shares may be slightly undervalued on this metric.
Result: UNDERVALUED
P/E ratios tell one story, but what if the real opportunity lies elsewhere? Start investing in legacies, not executives. Discover our 22 top founder-led companies.
Upgrade Your Decision Making: Choose your Signet Jewelers Narrative
Earlier we mentioned that there is an even better way to understand valuation, so let us introduce you to Narratives. A Narrative is simply your story about a company, backed by your numbers, where you connect your view on its brand, customers and competition to specific assumptions for future revenue, earnings and margins, which then roll into a fair value estimate. On Simply Wall St, millions of investors build and share these Narratives on the Community page, so you can see how different forecasts lead to different fair values and compare those to the current Signet price to help decide if it looks attractive or stretched to you. Narratives update automatically when new information such as earnings or news is added to the platform, so your story and fair value do not stay stale. For example, one Signet Narrative might assume a relatively cautious profit margin and arrive at a fair value well below US$97, while another uses more optimistic margins and sees a fair value well above the current price.
Do you think there's more to the story for Signet Jewelers? Head over to our Community to see what others are saying!

This article by Simply Wall St is general in nature. We provide commentary based on historical data and analyst forecasts only using an unbiased methodology and our articles are not intended to be financial advice. It does not constitute a recommendation to buy or sell any stock, and does not take account of your objectives, or your financial situation. We aim to bring you long-term focused analysis driven by fundamental data. Note that our analysis may not factor in the latest price-sensitive company announcements or qualitative material. Simply Wall St has no position in any stocks mentioned.