Is It Too Late To Consider Stryker (SYK) After Recent Valuation Checks?
Stryker Corporation SYK | 331.54 | +0.65% |
- If you are wondering whether Stryker shares are offering good value right now, it helps to separate the story from the numbers we can actually measure.
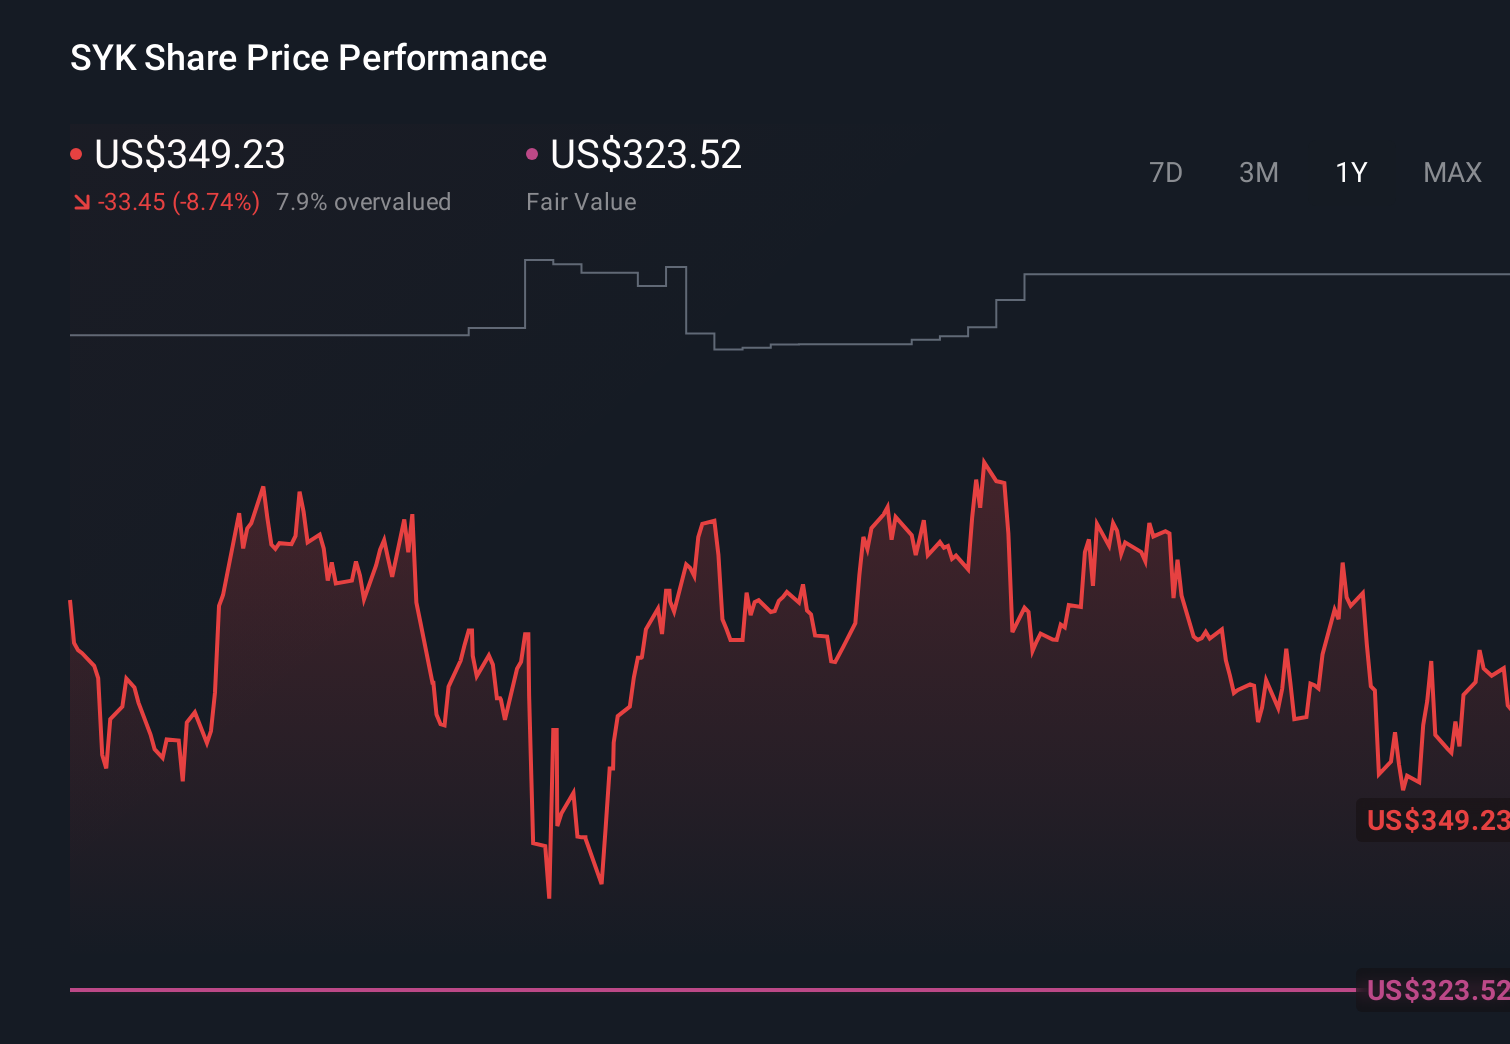
- The stock last closed at US$369.56, with returns of 4.1% over 7 days, 5.1% over 30 days, 6.1% year to date, 34.4% over 3 years and 63.0% over 5 years, while the 1 year return sits at a 4.7% decline.
- Recent headlines around Stryker have kept investor attention on how the company is positioned in the medical technology and healthcare space, and what that might mean for its longer term prospects. These updates help frame whether the recent share price moves reflect changing expectations or simply short term sentiment shifts.
- Despite this backdrop, Stryker currently holds a valuation score of 0/6. This means it is assessed as undervalued in none of the six basic checks we will walk through next. We will also look at a more complete way to think about valuation by the end of the article.
Stryker scores just 0/6 on our valuation checks. See what other red flags we found in the full valuation breakdown.
Approach 1: Stryker Discounted Cash Flow (DCF) Analysis
A Discounted Cash Flow, or DCF, model takes estimates of the cash a company could generate in the future and discounts those cash flows back to today, aiming to arrive at an implied value per share.
For Stryker, the model used here is a 2 Stage Free Cash Flow to Equity approach, based on cash flow projections. The latest twelve month free cash flow is about $4.27b. Analyst inputs and extrapolated estimates point to projected free cash flow of around $6.01b in 2028, with a full set of ten year projections stepping up from $4.40b in 2026 to about $8.55b in 2035, all in $ terms.
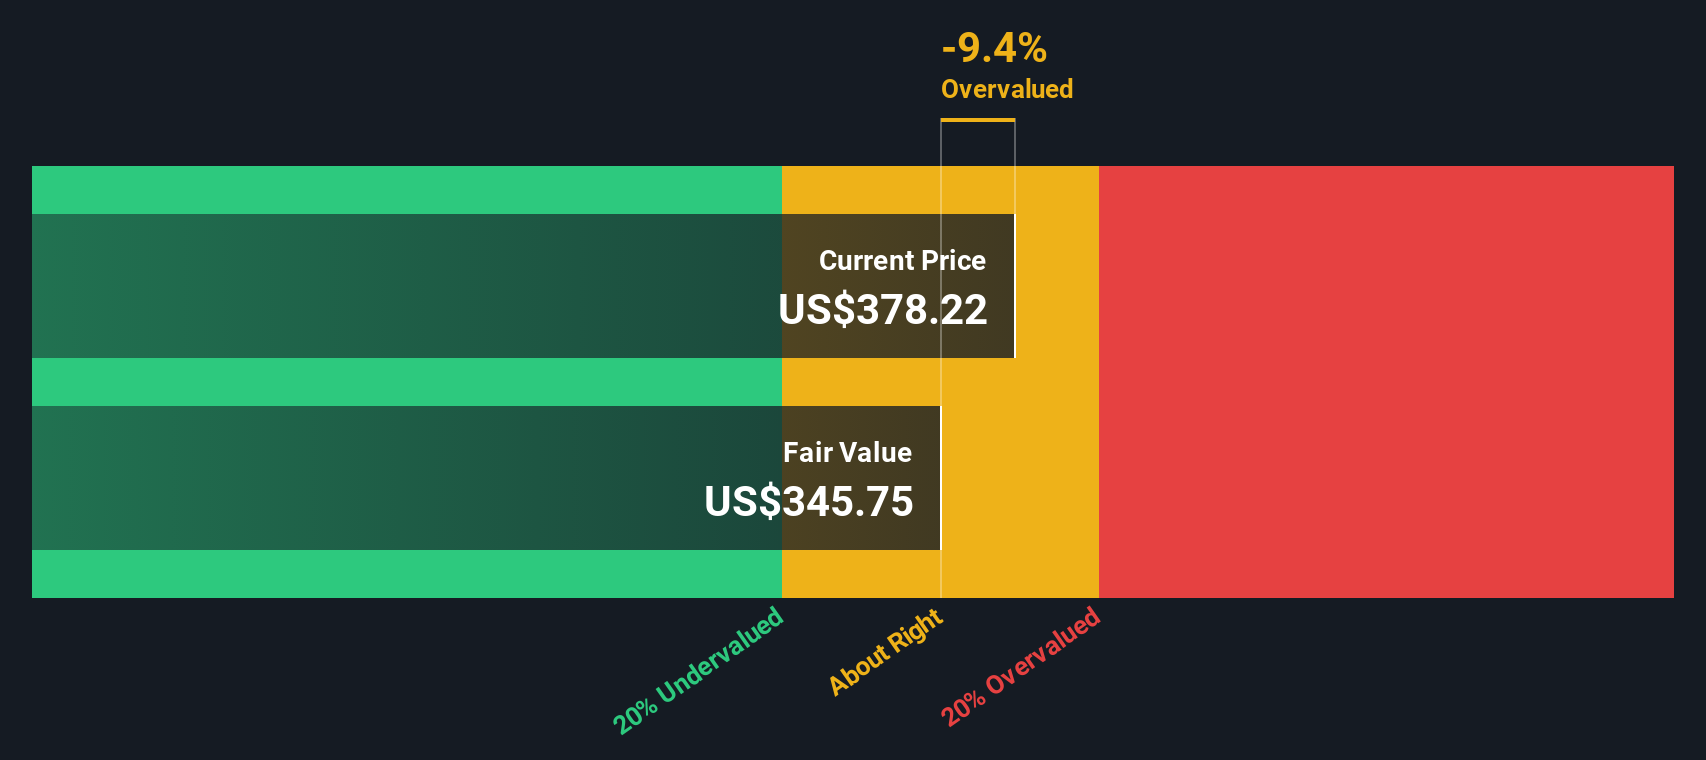
When those projected cash flows are discounted, the model suggests an estimated intrinsic value of roughly $349.37 per share. Compared with the recent share price of $369.56, this implies the stock is about 5.8% overvalued, which is a relatively small gap and could easily sit within a normal margin of error for this kind of model.
Result: ABOUT RIGHT
Stryker is fairly valued according to our Discounted Cash Flow (DCF), but this can change at a moment's notice. Track the value in your watchlist or portfolio and be alerted on when to act.
Approach 2: Stryker Price vs Earnings
For profitable companies like Stryker, the P/E ratio is a straightforward way to link what you pay for each share to the earnings that support that price. Investors usually look for a P/E level that lines up with their expectations for future growth and the risk they see in those earnings, so higher growth and lower perceived risk often go together with a higher “normal” P/E, and the reverse is also true.
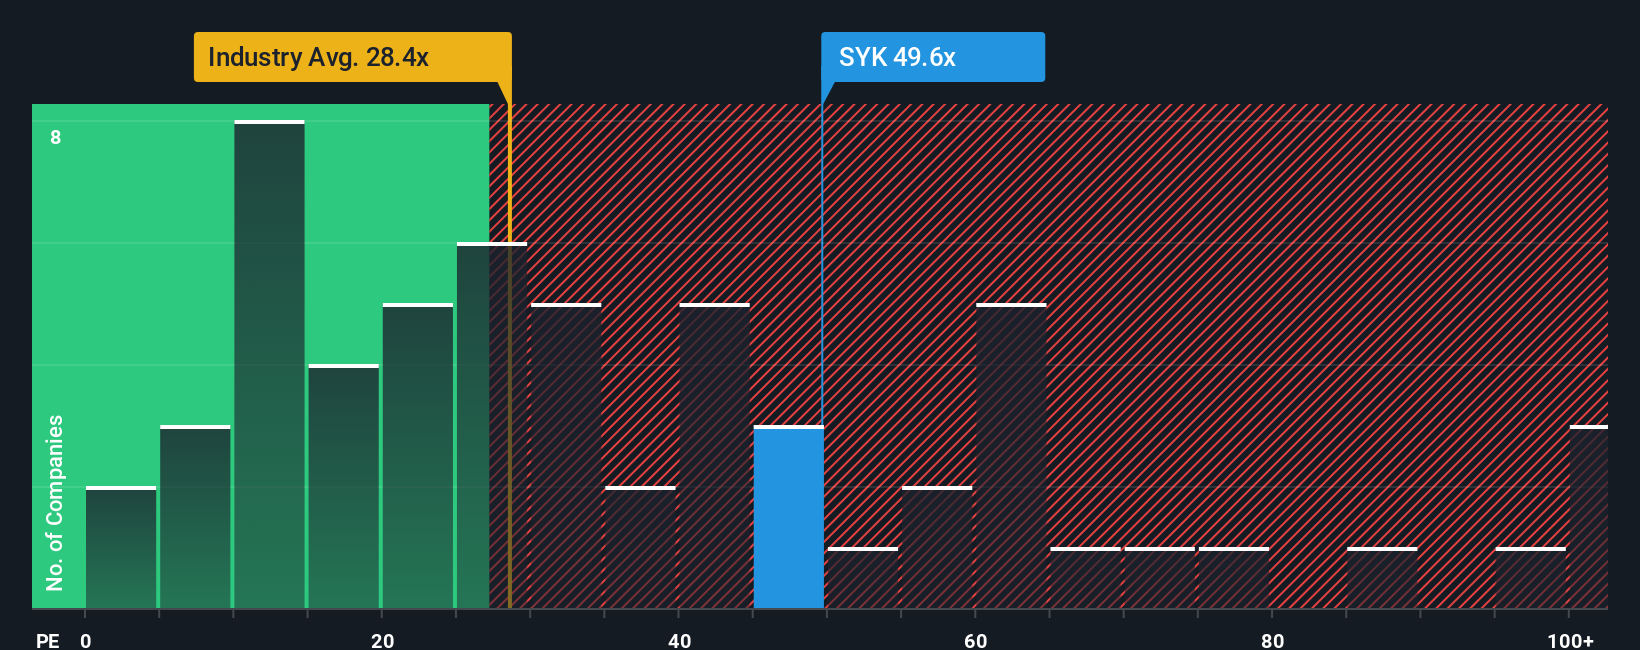
Stryker currently trades on a P/E of 43.54x. That sits above the Medical Equipment industry average of 31.08x and slightly above the peer average of 42.28x. Simply Wall St’s Fair Ratio for Stryker is 40.15x, which is its proprietary estimate of what the P/E “should” be given factors such as earnings growth, profit margins, industry, market cap and company specific risks. This Fair Ratio can be more useful than a simple comparison with peers or the wider industry, because it adjusts for Stryker’s own characteristics rather than assuming all companies deserve the same multiple.
Compared with that Fair Ratio of 40.15x, Stryker’s current P/E of 43.54x points to the shares trading at a premium, suggesting they are overvalued on this metric.
Result: OVERVALUED
P/E ratios tell one story, but what if the real opportunity lies elsewhere? Discover 1420 companies where insiders are betting big on explosive growth.
Upgrade Your Decision Making: Choose your Stryker Narrative
Earlier we mentioned that there is an even better way to understand valuation, so let us introduce you to Narratives, which simply means writing the story you believe about a company and tying that story to your own numbers for fair value, future revenue, earnings and margins.
A Narrative connects three things in a straight line: what you think is happening with the business, how that view translates into a financial forecast and the fair value that drops out of those forecasts.
On Simply Wall St, Narratives sit in the Community page and are used by millions of investors. This allows you to quickly see different fair values for Stryker and compare them with today’s share price to help decide whether you see it as closer to a buy, a hold or a sell for your own situation.
Because Narratives update automatically when new information like earnings releases or news headlines arrives, you are not locked into a static view. You can always see how your fair value for Stryker shifts compared with someone who has set a much higher or much lower value using different assumptions.
Do you think there's more to the story for Stryker? Head over to our Community to see what others are saying!
This article by Simply Wall St is general in nature. We provide commentary based on historical data and analyst forecasts only using an unbiased methodology and our articles are not intended to be financial advice. It does not constitute a recommendation to buy or sell any stock, and does not take account of your objectives, or your financial situation. We aim to bring you long-term focused analysis driven by fundamental data. Note that our analysis may not factor in the latest price-sensitive company announcements or qualitative material. Simply Wall St has no position in any stocks mentioned.