Is It Too Late To Consider Sunbelt Rentals Holdings (SUNB) After A 41% One Year Rally?
Sunbelt Rentals Holdings Inc SUNB | 0.00 |
- Wondering if Sunbelt Rentals Holdings at around US$76.92 is still offering value, or if the easy money has already been made? This article breaks down what the current price might be implying.
- The stock has returned 0.1% over the past week, 21.9% over the last 30 days, 15.5% year to date and 41.3% over the past year, so recent moves may have shifted how you think about both upside and risk.
- Recent coverage has focused on Sunbelt Rentals Holdings as a key player in capital goods and equipment rental, with investors watching how its positioning ties into construction and industrial activity. Headlines around sector demand and capital investment trends provide useful context when weighing how much optimism is already reflected in the share price.
- On Simply Wall St's 6 point value checklist the company scores 5 out of 6. Next up is a closer look at how different valuation approaches stack up, along with a more complete way to think about value that ties everything together by the end of the article.
Approach 1: Sunbelt Rentals Holdings Discounted Cash Flow (DCF) Analysis
A Discounted Cash Flow, or DCF, model estimates what a company might be worth by projecting its future cash flows and then discounting them back to today using a required rate of return.
For Sunbelt Rentals Holdings, the model uses a 2 Stage Free Cash Flow to Equity approach, starting from last twelve months free cash flow of about $1.14b. Analysts provide explicit forecasts for the early years, and Simply Wall St extrapolates further out, with projected free cash flow of $2.40b in 2030. A series of yearly projections from 2026 through 2035 is discounted back to today using this method.
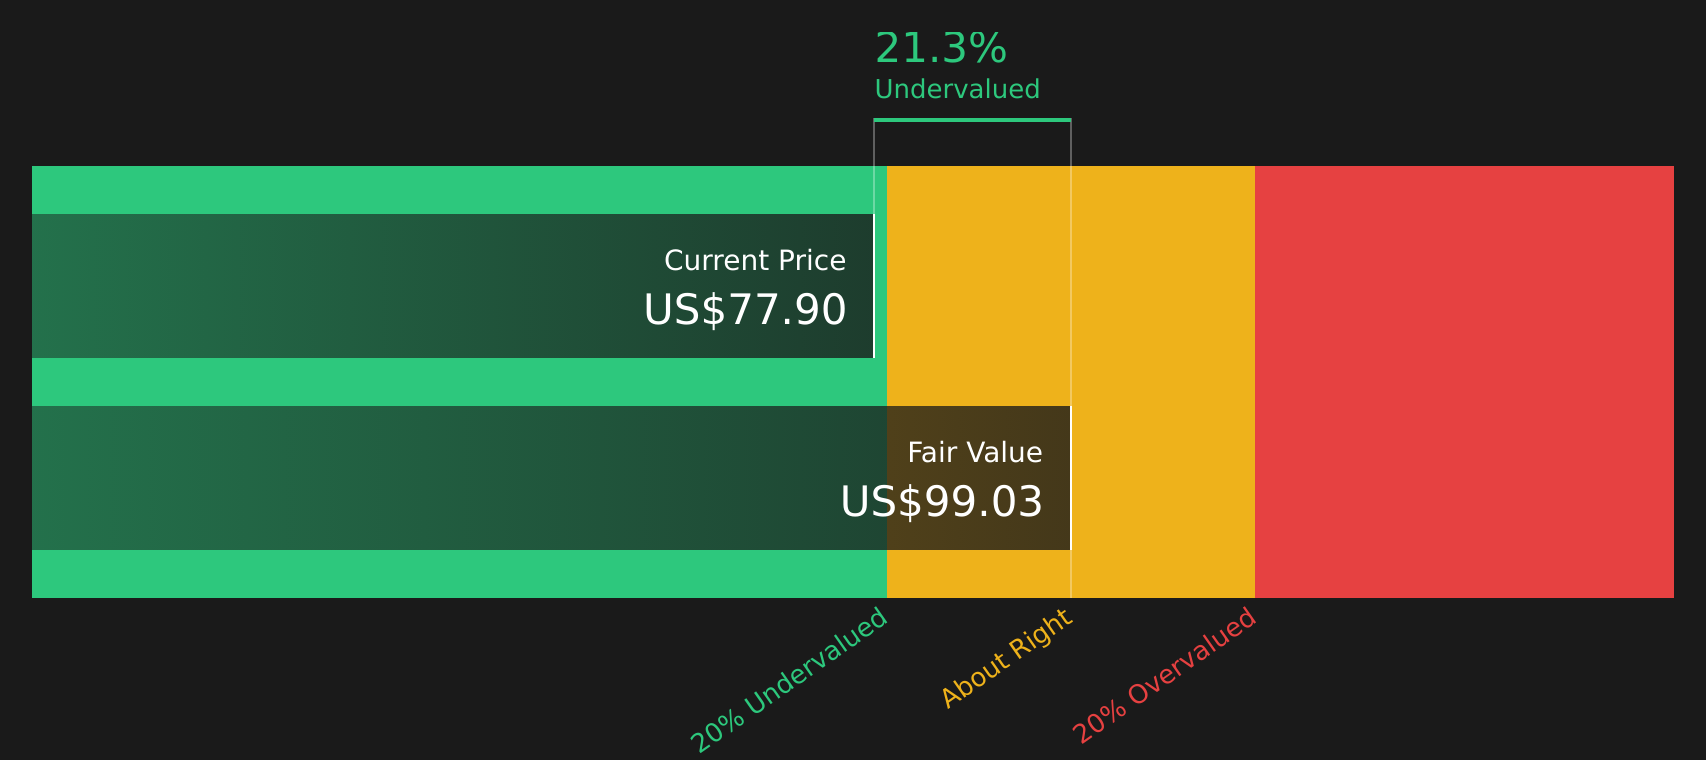
Aggregating these discounted cash flows gives an estimated intrinsic value of US$97.61 per share, compared with the recent share price of about US$76.92. On this basis, the DCF implies the stock trades at roughly a 21.2% discount, which indicates that, under the assumptions used in this model, investors are paying less than the model’s estimate of the underlying cash flow value.
Result: UNDERVALUED (according to this DCF model)
Our Discounted Cash Flow (DCF) analysis suggests Sunbelt Rentals Holdings is undervalued by 21.2%. Track this in your watchlist or portfolio, or discover 50 more high quality undervalued stocks.
Approach 2: Sunbelt Rentals Holdings Price vs Earnings
P/E is a useful way to look at profitable companies because it links what you pay for each share directly to the earnings that business is producing today. As a rule of thumb, higher growth expectations or lower perceived risk tend to justify a higher “normal” P/E, while slower growth or higher risk usually point to a lower one.
Sunbelt Rentals Holdings currently trades on a P/E of 22.78x. That sits below the Trade Distributors industry average P/E of 24.27x and also below the peer group average of 25.69x. At first glance, this suggests the market is pricing Sunbelt Rentals Holdings at a discount to many comparable names in its space.
Simply Wall St’s Fair Ratio framework goes a step further by estimating what P/E might make sense for Sunbelt Rentals Holdings, given its earnings growth profile, industry, profit margins, market cap and risk factors. This tailored Fair Ratio is 37.20x, which is higher than the current 22.78x. Because the Fair Ratio tries to align valuation with the company’s specific fundamentals rather than broad peer or industry averages, it can provide a more company focused anchor for your expectations.
Result: UNDERVALUED

P/E ratios tell one story, but what if the real opportunity lies elsewhere? Start investing in legacies, not executives. Discover our 17 top founder-led companies.
Upgrade Your Decision Making: Choose your Sunbelt Rentals Holdings Narrative
Earlier there was mention that there is an even better way to understand valuation, so Narratives step in by letting you spell out the story you believe about Sunbelt Rentals Holdings, link that story to explicit forecasts for revenue, earnings and margins, and then see the fair value that drops out of those numbers.
On Simply Wall St’s Community page, Narratives are an easy tool that connect a company’s story to a full forecast and a fair value, so you can compare that fair value to the current share price and decide whether the stock looks attractive, fully valued or expensive based on your own assumptions.
Narratives also update as new information such as news or earnings is added to the platform, so the link between what is happening in the business and the value you see on screen stays current rather than fixed at the time you first ran the numbers.
For Sunbelt Rentals Holdings, one Narrative might lean toward the lower fair value of about US$62 based on revenue growth of 4.5% and a future P/E of 14.5x. Another might lean toward the higher fair value of about US$106.5 with revenue growth of 10.2% and a future P/E of 19.6x, and seeing that spread helps you decide which story you find more convincing.
For Sunbelt Rentals Holdings however we will make it really easy for you with previews of two leading Sunbelt Rentals Holdings Narratives:
Start by asking which of these versions of the future feels closer to your own view, then decide how much confidence you have in that story and what it implies for the current share price around US$76.92.
Fair value in this bullish Narrative: US$106.50
Implied discount to this fair value at US$76.92: about 27.8%.
Assumed revenue growth: 10.25% a year.
- Assumes mega projects in data centers, health care, infrastructure, energy and manufacturing, plus recent large project wins, support multi year rental cycles and capital efficiency.
- Sees faster growth in higher return Specialty lines and full solution offerings, with operational programs and pricing tools supporting margins, ROI and free cash flow.
- Aligns with the bullish analyst cohort that models revenue of about US$14.6b and earnings of about US$2.5b by 2029, on a future P/E of 19.6x and a discount rate near 8.7%.
Fair value in this bearish Narrative: US$62.00
Implied premium to this fair value at US$76.92: about 24.1%.
Assumed revenue growth: 4.49% a year.
- Focuses on the risk that long mega project cycles tie up fleet and that any uplift in local nonresidential construction takes time to show up, which could limit rental revenue efficiency and margins.
- Highlights heavier CapEx, a growing share of lower margin Specialty and ancillary revenue and potential execution challenges in pricing and logistics programs as possible headwinds for free cash flow and EBITDA margin.
- Aligns with the bearish analyst cohort that models revenue of about US$12.5b and earnings of about US$2.0b by 2029, on a future P/E of 14.5x and a discount rate near 8.8%.
These Narratives sit on either side of the current price and help frame the trade off between growth expectations, margin assumptions and what you are willing to pay for the stock today.
If you want to see how the rest of the community is joining the dots between these stories, valuation models and risks, To see how these results tie into long-term growth, risks, and valuation, check out the full range of community narratives for Sunbelt Rentals Holdings on Simply Wall St. Add the company to your watchlist or portfolio so you'll be alerted when the story evolves.
Do you think there's more to the story for Sunbelt Rentals Holdings? Head over to our Community to see what others are saying!

This article by Simply Wall St is general in nature. We provide commentary based on historical data and analyst forecasts only using an unbiased methodology and our articles are not intended to be financial advice. It does not constitute a recommendation to buy or sell any stock, and does not take account of your objectives, or your financial situation. We aim to bring you long-term focused analysis driven by fundamental data. Note that our analysis may not factor in the latest price-sensitive company announcements or qualitative material. Simply Wall St has no position in any stocks mentioned.