

Is It Too Late To Consider TD SYNNEX (SNX) After A 92% One-Year Rally?
TD SYNNEX SNX | 0.00 |
- If you are wondering whether TD SYNNEX at around US$237 per share still offers value after a strong run, the starting point is to understand what the current price actually implies.
- The stock has posted returns of 4.9% over the past week, 4.2% over the past month, 54.7% year to date and 92.2% over the past year, which naturally raises questions about how much of the story is already reflected in the share price.
- Recent attention on TD SYNNEX has focused on its role as a major technology distributor and solutions provider, as investors reassess how such businesses fit into broader tech spending trends. There has also been ongoing interest in how distribution and services companies are positioned in relation to themes like cloud, AI infrastructure and hardware refresh cycles, which can affect sentiment around the stock.
- On Simply Wall St's valuation checks, TD SYNNEX scores 4 out of 6. This sets up a closer look at how metrics like P/E, cash flows and asset based measures stack up, and points toward a different way of thinking about value that will be covered at the end of this article.
Approach 1: TD SYNNEX Discounted Cash Flow (DCF) Analysis
A Discounted Cash Flow, or DCF, model estimates what a stock could be worth by projecting future cash flows and discounting them back to today’s value using a required return. It focuses on cash that could, in theory, be returned to shareholders over time.
For TD SYNNEX, the model used is a 2 Stage Free Cash Flow to Equity approach based on cash flow projections. The latest twelve month Free Cash Flow is about $1.22b, and analyst and extrapolated estimates point to Free Cash Flow of around $1.49b in 2028 and $1.93b by 2035. These projections, expressed in $, are discounted back over ten years to reflect the time value of money and risk.
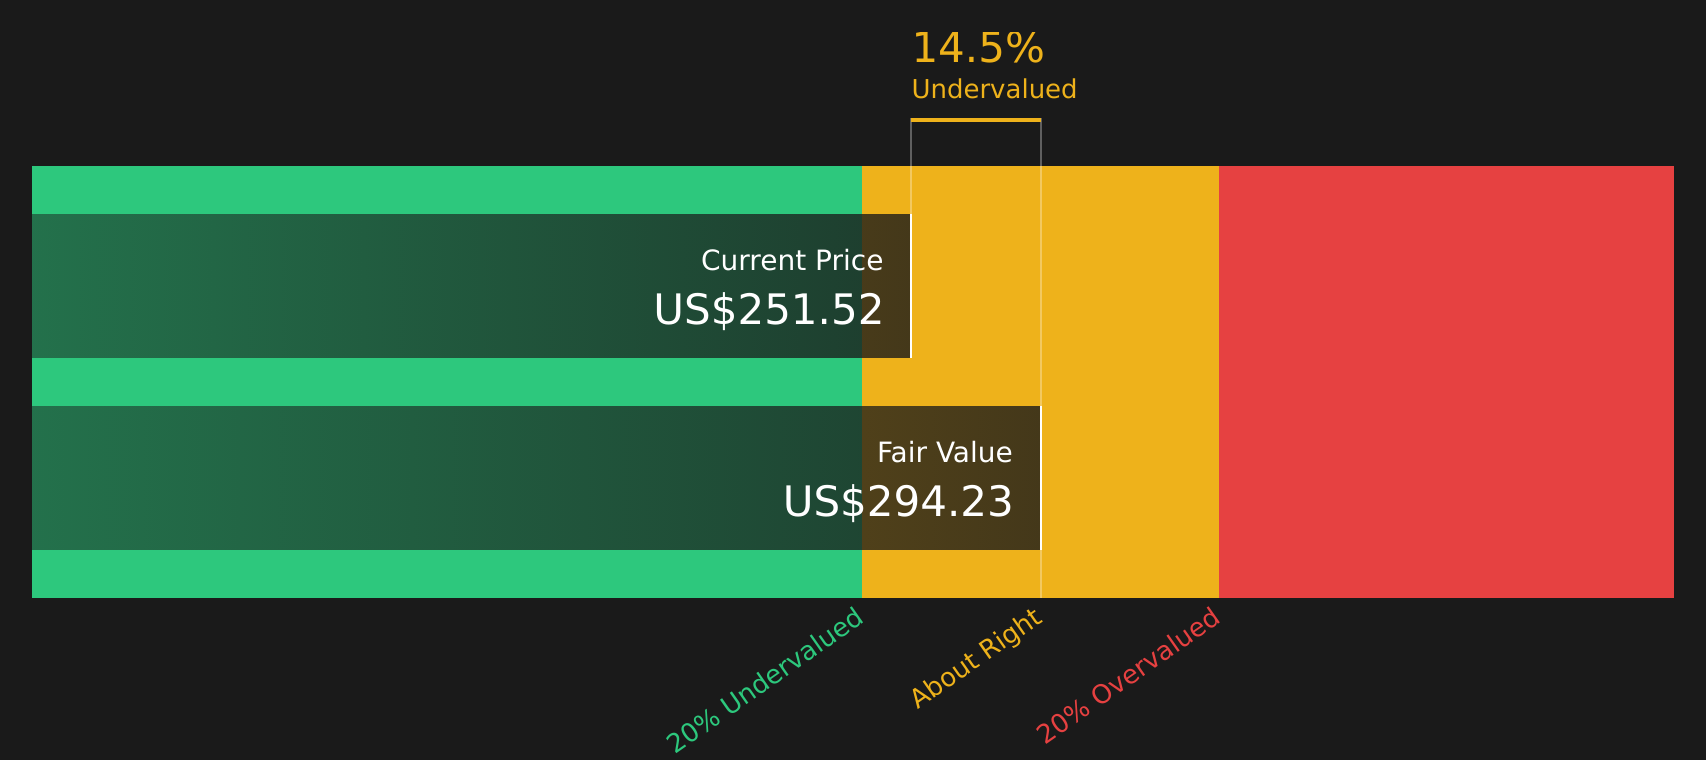
On this basis, Simply Wall St’s DCF output suggests an estimated intrinsic value of about $286.26 per share. Compared with a share price around $237, this implies the stock trades at roughly a 17.1% discount to that DCF estimate, which indicates TD SYNNEX screens as undervalued on this method alone.
Result: UNDERVALUED
Our Discounted Cash Flow (DCF) analysis suggests TD SYNNEX is undervalued by 17.1%. Track this in your watchlist or portfolio, or discover 48 more high quality undervalued stocks.
Approach 2: TD SYNNEX Price vs Earnings
For profitable companies, the P/E ratio is a useful way to link what you pay for each share to the earnings that support that price. It helps you judge whether you are paying a higher or lower price for each dollar of earnings compared with what is typical for similar stocks.
What counts as a “normal” or “fair” P/E usually reflects expectations for future earnings growth and the level of risk. Higher expected growth or lower perceived risk can justify a higher P/E, while slower growth or higher risk tends to support a lower P/E.
TD SYNNEX currently trades on a P/E of about 19.48x. That sits slightly below the peer average of 19.64x and well below the broader Electronic industry average of 29.97x. Simply Wall St’s Fair Ratio for TD SYNNEX is 25.57x, which is a proprietary estimate of what the P/E might be given factors such as earnings growth profile, industry, profit margins, market cap and key risks.
Because the Fair Ratio directly incorporates those company specific drivers, it can offer a more tailored reference point than simple peer or industry comparisons. With the current P/E of 19.48x below the Fair Ratio of 25.57x, TD SYNNEX appears undervalued on this metric.
Result: UNDERVALUED

P/E ratios tell one story, but what if the real opportunity lies elsewhere? Start investing in legacies, not executives. Discover our 20 top founder-led companies.
Upgrade Your Decision Making: Choose your TD SYNNEX Narrative
Earlier it was mentioned that there is an even better way to understand valuation. This is where Narratives come in, letting you attach a clear story about TD SYNNEX to the numbers you see on Simply Wall St by linking your view of its revenue, earnings and margins to a forecast and a Fair Value. You can then compare this with the current share price to help decide whether the stock looks attractive or expensive, all within an easy tool on the Community page that updates automatically when new news or earnings arrive. Different investors can set out very different views, such as a more optimistic TD SYNNEX Narrative that assumes a Fair Value around US$271.00 and earnings reaching about US$1.3b by 2029 with a P/E of 20.6x, versus a more cautious Narrative that assumes a Fair Value closer to US$166.00, earnings nearer US$1.1b and a P/E of 15.0x. This gives you a clear sense of the range of possible stories behind the same stock.
For TD SYNNEX, here are previews of two leading TD SYNNEX Narratives:
Fair Value: US$271.00
Implied discount vs fair value: about 12.5% below this narrative fair value
Revenue growth assumption: 6.77% per year
- Leans on stronger demand for cloud, AI infrastructure and Hyve full rack programs across the top 5 US hyperscalers to support higher gross billings and operating income.
- Assumes earnings reach about US$1.3b by 2029 with a P/E of 20.6x, alongside slightly higher profit margins and fewer shares outstanding each year.
- Highlights vendor recognition and expanded digital tools as factors that could support higher distribution billings, better operating leverage and a higher fair value of US$271.00.
Fair Value: US$227.82
Implied premium vs fair value: about 4.2% above this narrative fair value
Revenue growth assumption: 5.70% per year
- Focuses on a more moderate earnings path to about US$1.2b by 2029, using a 19.1x P/E and keeping profit margins around current levels.
- Flags risks such as pulled forward demand, margin pressure in Hyve, macro and geopolitical uncertainty and customer concentration around large accounts.
- Frames the current share price close to the consensus fair value of about US$227.82, suggesting limited valuation gap if these assumptions play out.
Do you think there's more to the story for TD SYNNEX? Head over to our Community to see what others are saying!

This article by Simply Wall St is general in nature. We provide commentary based on historical data and analyst forecasts only using an unbiased methodology and our articles are not intended to be financial advice. It does not constitute a recommendation to buy or sell any stock, and does not take account of your objectives, or your financial situation. We aim to bring you long-term focused analysis driven by fundamental data. Note that our analysis may not factor in the latest price-sensitive company announcements or qualitative material. Simply Wall St has no position in any stocks mentioned.