

Is It Too Late To Consider TechnipFMC (FTI) After A 137% One-Year Surge?
TechnipFMC plc FTI | 0.00 |
- If you are wondering whether TechnipFMC at around US$71.41 is still offering value or starting to look stretched, the next sections will break down what the current price may be implying.
- The stock has pulled back recently, with the share price down 3.3% over the past week and 4.5% over the past month, while still sitting on a 50.9% gain year to date and a 137.0% gain over the past year.
- These moves have come as TechnipFMC continues to draw attention as an energy services stock, with investors reacting to ongoing contract awards, project updates and sector sentiment shifts that affect expectations for future activity. Together, these factors help explain why the stock has seen both strong long term returns and shorter term share price volatility.
- Currently, TechnipFMC scores 4 out of 6 on Simply Wall St's valuation checks, giving it a 4/6 valuation score. The rest of this article will walk through those valuation approaches, while also pointing to a more holistic way to think about the stock's value at the end.
Approach 1: TechnipFMC Discounted Cash Flow (DCF) Analysis
A Discounted Cash Flow, or DCF, model estimates what a stock could be worth by projecting the cash it may generate in the future and then discounting those cash flows back to today.
For TechnipFMC, the model used is a 2 Stage Free Cash Flow to Equity approach. The latest twelve month free cash flow is about $1.35b. Analysts and extrapolated estimates suggest free cash flow moving to around $1.75b by 2030, with interim projections such as $1.33b for 2026 and $1.41b for 2027, all in $. These yearly cash flows are discounted back using Simply Wall St's assumptions to reflect their value in today's terms.
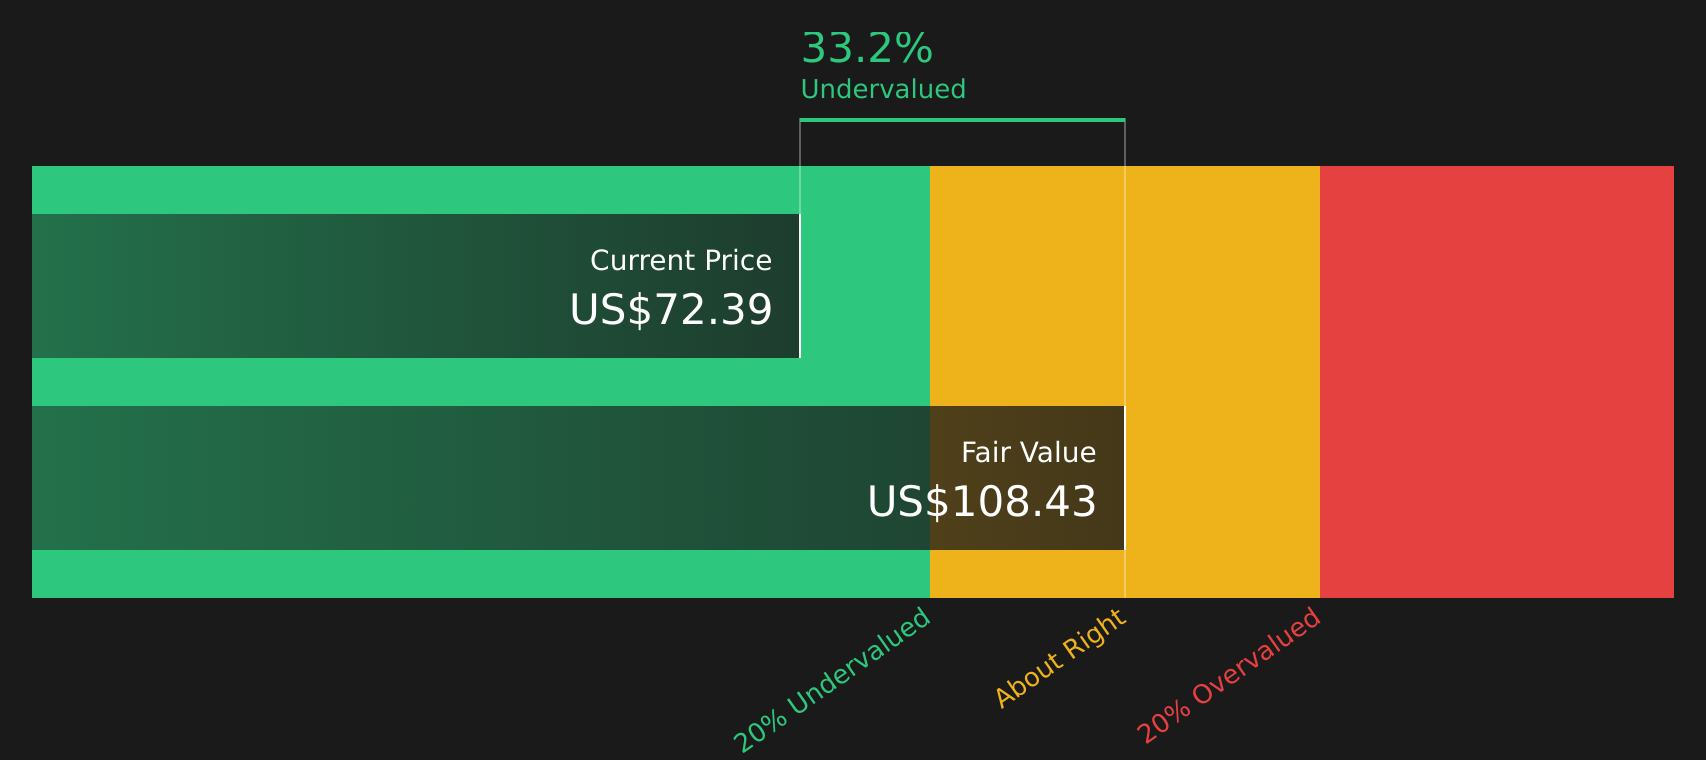
Putting those projections together, the DCF model arrives at an estimated intrinsic value of $92.61 per share. Compared with the recent share price around $71.41, this implies TechnipFMC trades at a 22.9% discount to that DCF estimate, which indicates the stock appears undervalued according to this model.
Result: UNDERVALUED
Our Discounted Cash Flow (DCF) analysis suggests TechnipFMC is undervalued by 22.9%. Track this in your watchlist or portfolio, or discover 46 more high quality undervalued stocks.
Approach 2: TechnipFMC Price vs Earnings
For profitable companies, the P/E ratio is a useful way to think about value because it links what you pay for each share with the earnings that each share generates. A higher P/E often reflects stronger growth expectations or lower perceived risk, while a lower P/E can reflect weaker growth expectations or higher perceived risk.
TechnipFMC currently trades on a P/E of 26.30x. This sits close to the Energy Services industry average P/E of 26.68x and below the broader peer average of 38.22x. At first glance, that suggests the stock is priced in line with the sector and below some peers, but that alone does not tell you if the valuation is justified.
Simply Wall St's Fair Ratio for TechnipFMC is 23.50x. This is a proprietary estimate of what the P/E might be given factors such as the company’s earnings growth profile, profit margins, industry, market cap and specific risks. Because it incorporates these fundamentals rather than just comparing against broad group averages, the Fair Ratio can be a more tailored benchmark. With the current P/E of 26.30x sitting above the Fair Ratio of 23.50x, the shares screen as overvalued on this metric.
Result: OVERVALUED

P/E ratios tell one story, but what if the real opportunity lies elsewhere? Start investing in legacies, not executives. Discover our 20 top founder-led companies.
Upgrade Your Decision Making: Choose your TechnipFMC Narrative
Earlier there was mention of an even better way to think about valuation, so this is where Narratives come in, giving you a simple story behind the numbers that links your view of TechnipFMC to assumptions about future revenue, earnings and margins, and then to a Fair Value that you can compare with the current price.
On Simply Wall St's Community page, Narratives are an accessible tool used by millions of investors. You can see or create a clear storyline, for example that offshore and deepwater projects, digitalization and energy transition work support a Fair Value around US$83.00, or that margin headwinds and execution risks point closer to US$41.37 or even US$30.00.
Each Narrative connects the company story to a full financial forecast. When news, earnings or guidance updates arrive, the Fair Value view updates, helping you quickly see whether TechnipFMC looks expensive or cheap relative to your chosen Narrative without needing to rebuild spreadsheets each time.
For TechnipFMC however we will make it really easy for you, with previews of two leading TechnipFMC Narratives:
Fair Value: US$83.00
Implied discount to this Narrative: 14.0% below its Fair Value
Revenue growth assumption: 10.33%
- Views TechnipFMC as a beneficiary of an extended subsea and offshore cycle, with a broad set of projects across regions such as Guyana, Suriname, Namibia and Mozambique supporting higher revenue and a more diversified order book.
- Assumes higher margins over time, helped by integrated iEPCI and Subsea 2.0 project models, greater exposure to gas projects, and investments in digitalization, automation and energy transition offerings such as offshore green hydrogen and carbon capture.
- Accepts risks around heavy offshore oil and gas exposure, long project cycles, regulatory pressure and competition for new low carbon work, but concludes that a Fair Value of US$83.00 can be justified if revenues reach about US$13.3b and earnings around US$1.7b by 2029 on a 20.8x P/E.
Fair Value: US$65.62
Implied premium to this Narrative: 9.2% above its Fair Value
Revenue growth assumption: 5.77%
- Sees TechnipFMC’s strong subsea position, record orders and long tail of services as already well reflected in the price, with rich pricing leaving less room for error as offshore expectations rise.
- Builds on more moderate revenue and margin assumptions than the bullish view, with earnings modeled around US$1.3b by 2029 on a 21.2x P/E, which supports a Fair Value of US$65.62 that sits below the recent share price.
- Flags dependency on oil and gas, geopolitical exposure in markets such as Mozambique and Nigeria, competition and a slower tilt toward energy transition projects as key reasons to treat the current valuation as execution sensitive rather than a clear bargain.
If these snapshots resonate, it may be worth stepping through the full set of Community Narratives, comparing the assumptions that align most closely with your own view of TechnipFMC’s projects, earnings power and risk profile, then deciding which Fair Value story you want to anchor to when judging where the stock sits today.
To see how these results tie into long-term growth, risks, and valuation, check out the full range of community narratives for TechnipFMC on Simply Wall St. Add the company to your watchlist or portfolio so you'll be alerted when the story evolves.
Do you think there's more to the story for TechnipFMC? Head over to our Community to see what others are saying!

This article by Simply Wall St is general in nature. We provide commentary based on historical data and analyst forecasts only using an unbiased methodology and our articles are not intended to be financial advice. It does not constitute a recommendation to buy or sell any stock, and does not take account of your objectives, or your financial situation. We aim to bring you long-term focused analysis driven by fundamental data. Note that our analysis may not factor in the latest price-sensitive company announcements or qualitative material. Simply Wall St has no position in any stocks mentioned.