Is It Too Late To Consider Tidewater (TDW) After Recent Share Price Strength?
Tidewater Inc TDW | 84.38 | +1.13% |
- If you are wondering whether Tidewater's share price still offers value or if most of the opportunity is already priced in, the next sections will walk through what the numbers are suggesting right now.
- At a last close of US$63.36, Tidewater's returns stand at 1.4% over 7 days, 19.0% over 30 days, 21.3% year to date, 17.6% over 1 year and a very large gain over 5 years. This naturally raises questions about how much upside or risk is currently baked into the valuation.
- Recent coverage has focused on Tidewater's position in offshore support services and the role its fleet plays in supporting offshore energy activity. This helps frame how investors think about long term demand for its services. Together with discussion around sector conditions and contract activity, this context helps explain why the share price has been in focus.
- Tidewater currently has a valuation score of 3 out of 6, based on checks of where it screens as undervalued. Next we will walk through what different valuation approaches say about that score before finishing with a broader way to think about what the valuation really implies.
Approach 1: Tidewater Discounted Cash Flow (DCF) Analysis
A Discounted Cash Flow, or DCF, model takes estimates of the cash Tidewater could generate in the future and discounts them back to what those cash flows might be worth in $ today.
For Tidewater, the model uses last twelve month free cash flow of about $285.2 million and a 2 Stage Free Cash Flow to Equity approach. Analysts provide explicit forecasts out to 2027, with free cash flow for that year projected at $357.5 million. Beyond that, Simply Wall St extrapolates further with a 10 year path that runs through estimates such as $267.8 million in 2026 and $536.4 million in 2035, all expressed in $ and then discounted back to today.
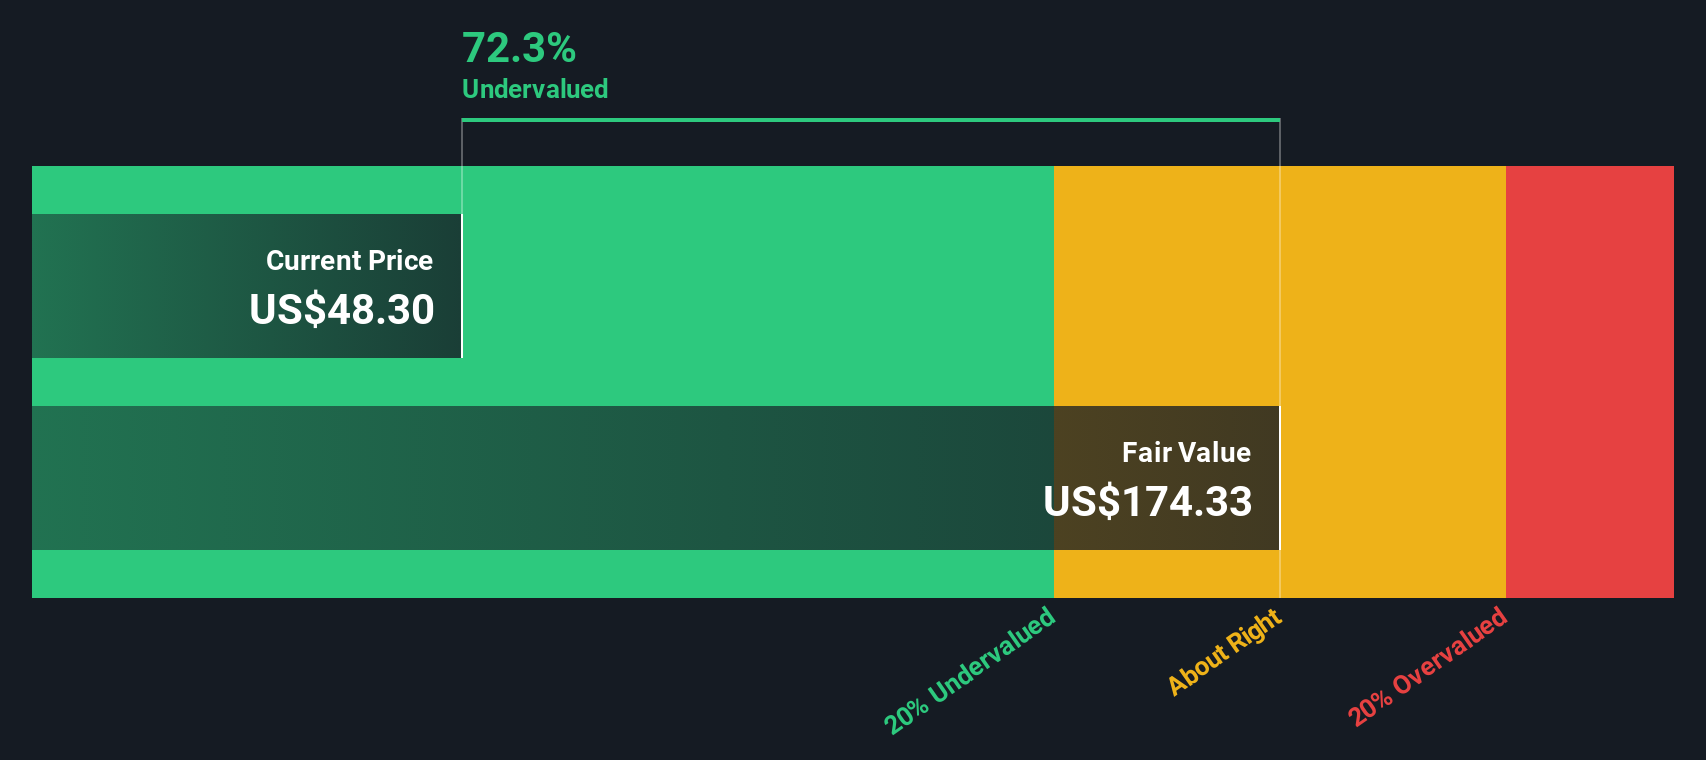
Aggregating these discounted cash flows results in an estimated intrinsic value of about $197.23 per share. Against Tidewater's recent share price of US$63.36, the model implies an intrinsic discount of 67.9%, which suggests the shares currently screen as materially undervalued on this DCF framework.
Result: UNDERVALUED
Our Discounted Cash Flow (DCF) analysis suggests Tidewater is undervalued by 67.9%. Track this in your watchlist or portfolio, or discover 55 more high quality undervalued stocks.
Approach 2: Tidewater Price vs Earnings
For a profitable company like Tidewater, the P/E ratio is a useful shorthand for how much investors are currently paying for each dollar of earnings. It ties directly to the bottom line, which is usually what ultimately supports a share price over time.
What counts as a "normal" P/E often reflects a mix of growth expectations and risk. Higher expected earnings growth or lower perceived risk can justify a higher P/E, while slower growth or higher uncertainty can point to a lower multiple.
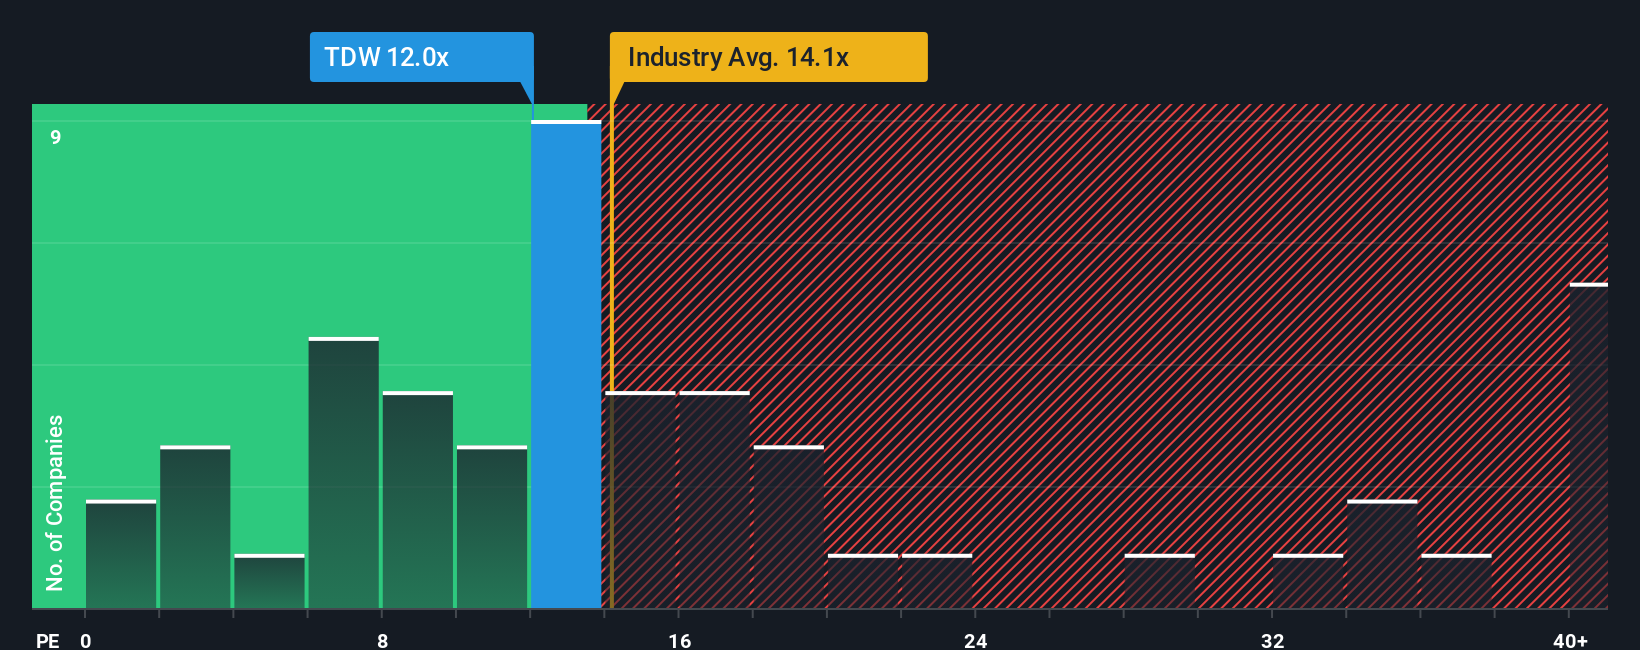
Tidewater currently trades on a P/E of about 20.7x. That sits slightly above its Energy Services peer average of around 20.5x, and below the broader industry average of about 23.2x, so it is not an outlier on simple comparisons.
Simply Wall St’s Fair Ratio for Tidewater is 18.3x. This is a proprietary estimate of what the P/E might be, given factors like earnings growth, industry, profit margins, market cap and company specific risks. Because it folds these company specific attributes into a single metric, the Fair Ratio can be more tailored than using only peer or industry averages.
Comparing the current P/E of 20.7x with the Fair Ratio of 18.3x suggests Tidewater screens as somewhat expensive on this earnings based view.
Result: OVERVALUED
P/E ratios tell one story, but what if the real opportunity lies elsewhere? Start investing in legacies, not executives. Discover our 22 top founder-led companies.
Upgrade Your Decision Making: Choose your Tidewater Narrative
Earlier we mentioned that there is an even better way to understand valuation, so let us introduce you to Narratives, which simply means writing the story you believe about Tidewater and linking that story directly to your forecast numbers and fair value.
On Simply Wall St’s Community page, Narratives let you set assumptions for future revenue, earnings and margins, connect those to a fair value estimate, and then compare that fair value with the current share price to help you decide whether Tidewater looks attractive, fully priced or expensive for your view.
Because Narratives update when new information like news or earnings arrives, you are not locked into a static model. You can quickly adjust your story and see how your fair value changes as the facts change.
For example, one Tidewater Narrative might assume higher long term vessel utilization and stronger margins that support a higher fair value, while another might assume more modest demand and tighter margins that point to a lower fair value. This shows how two investors can look at the same company and reach different but structured conclusions.
Do you think there's more to the story for Tidewater? Head over to our Community to see what others are saying!
This article by Simply Wall St is general in nature. We provide commentary based on historical data and analyst forecasts only using an unbiased methodology and our articles are not intended to be financial advice. It does not constitute a recommendation to buy or sell any stock, and does not take account of your objectives, or your financial situation. We aim to bring you long-term focused analysis driven by fundamental data. Note that our analysis may not factor in the latest price-sensitive company announcements or qualitative material. Simply Wall St has no position in any stocks mentioned.