Is It Too Late To Consider Ubiquiti (UI) After A 36% One-Year Rally?
UBIQUITI INC UI | 0.00 |
- If you are wondering whether Ubiquiti’s recent share price puts it at an attractive entry point or a stretched one, this article walks through the key valuation angles you should be thinking about.
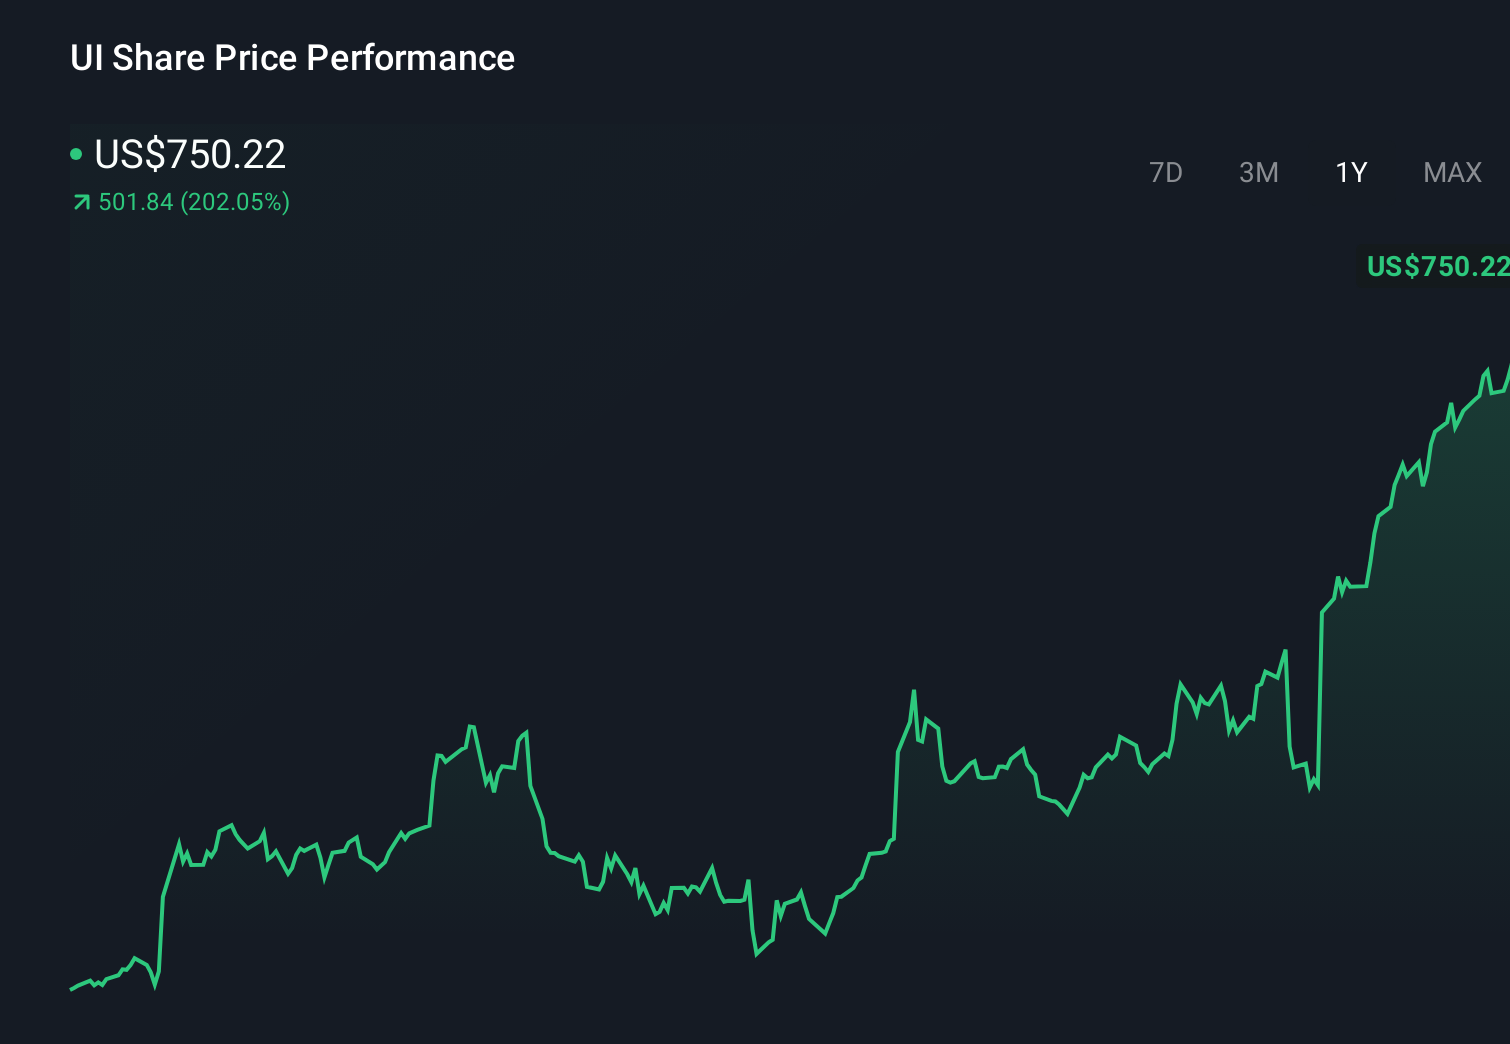
- The stock last closed at US$553.52, with returns of 0.8% over 7 days, a 0.9% decline over 30 days, a 2.3% decline year to date, and a 35.6% gain over 1 year, alongside gains of 104.0% over 3 years and 122.0% over 5 years.
- Recent price moves are best viewed against ongoing investor interest in Ubiquiti’s networking hardware and software ecosystem, as investors weigh its role in the broader technology sector. At the same time, the market has been digesting company specific updates and sector news that can quickly change sentiment. This is why grounding any view in valuation work is useful.
- Right now Ubiquiti has a valuation score of 0 out of 6. Next we will look at what traditional approaches like DCFs and multiples say about that, before finishing with a more holistic way to think about the company’s value.
Ubiquiti scores just 0/6 on our valuation checks. See what other red flags we found in the full valuation breakdown.
Approach 1: Ubiquiti Discounted Cash Flow (DCF) Analysis
A Discounted Cash Flow model estimates what a company might be worth by projecting its future cash flows and then discounting those back to today’s value using a required rate of return.
For Ubiquiti, the 2 Stage Free Cash Flow to Equity model starts with last twelve months free cash flow of about $587.5 million. Simply Wall St then applies analyst estimates where available and extends them, so later years are extrapolated rather than based on direct analyst forecasts.
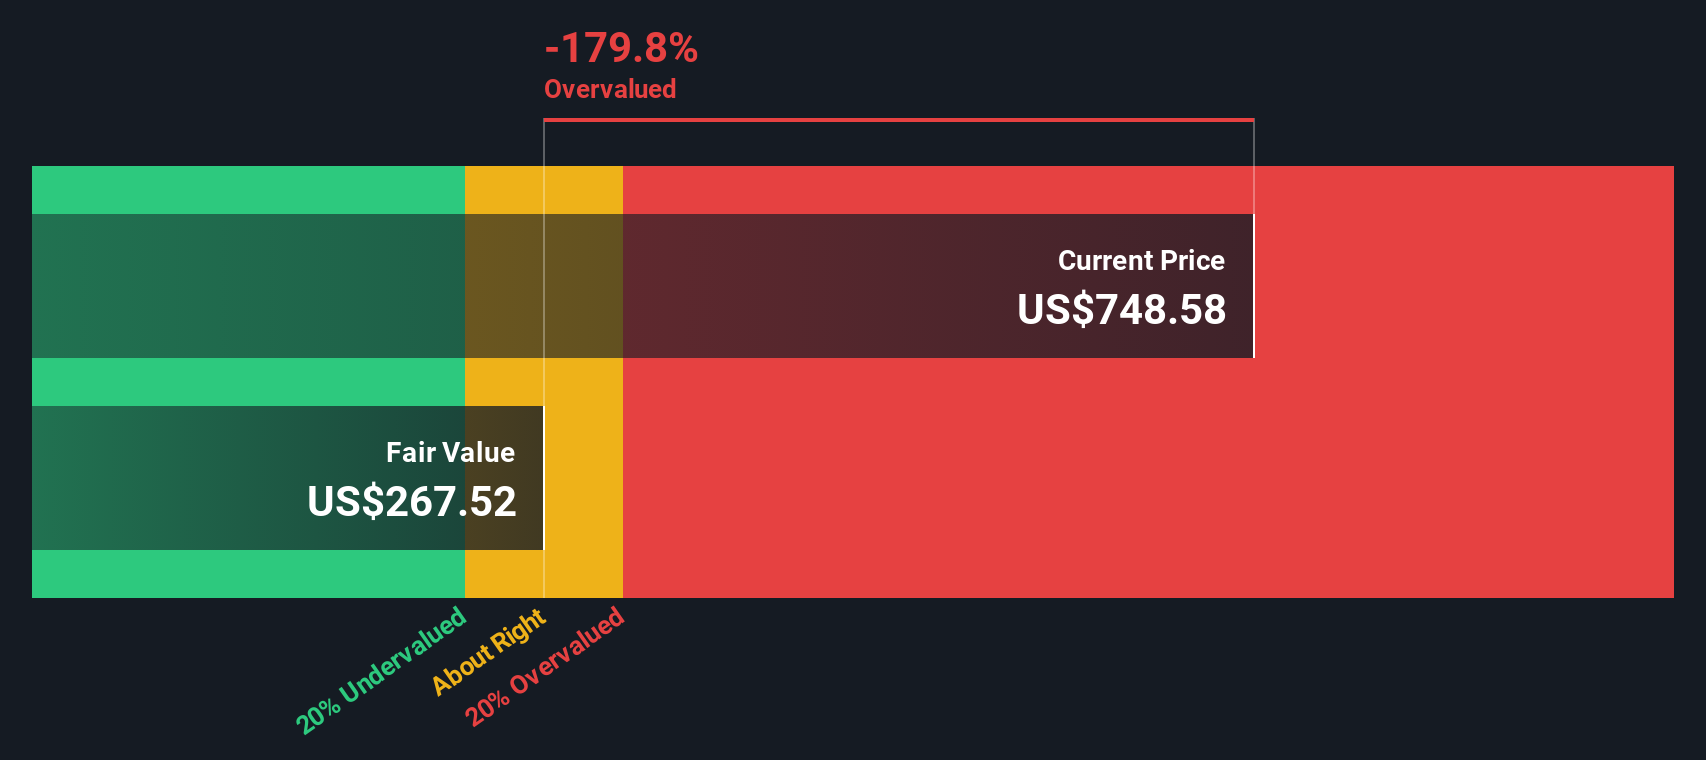
On this basis, projected free cash flow for 2035 is about $528.4 million, with interim years generally sitting in a similar $480 million to $530 million range. Discounting these projected cash flows back to today and adding a terminal value leads to an estimated intrinsic value of about $141.78 per share.
Compared with the recent share price of $553.52, the DCF output suggests Ubiquiti is trading at a level that is significantly higher than this model’s fair value estimate, with an implied overvaluation of about 290.4% relative to that estimate.
Result: OVERVALUED
Our Discounted Cash Flow (DCF) analysis suggests Ubiquiti may be overvalued by 290.4%. Discover 868 undervalued stocks or create your own screener to find better value opportunities.
Approach 2: Ubiquiti Price vs Earnings
For profitable companies, the P/E ratio is a useful yardstick because it links what you pay per share to what the business is actually earning per share. It lets you see how many dollars investors are currently willing to pay for each dollar of earnings.
What counts as a “normal” P/E depends a lot on how the market sees a company’s growth prospects and risk. Higher expected growth or lower perceived risk usually support a higher P/E, while slower growth or higher risk tend to justify a lower one.
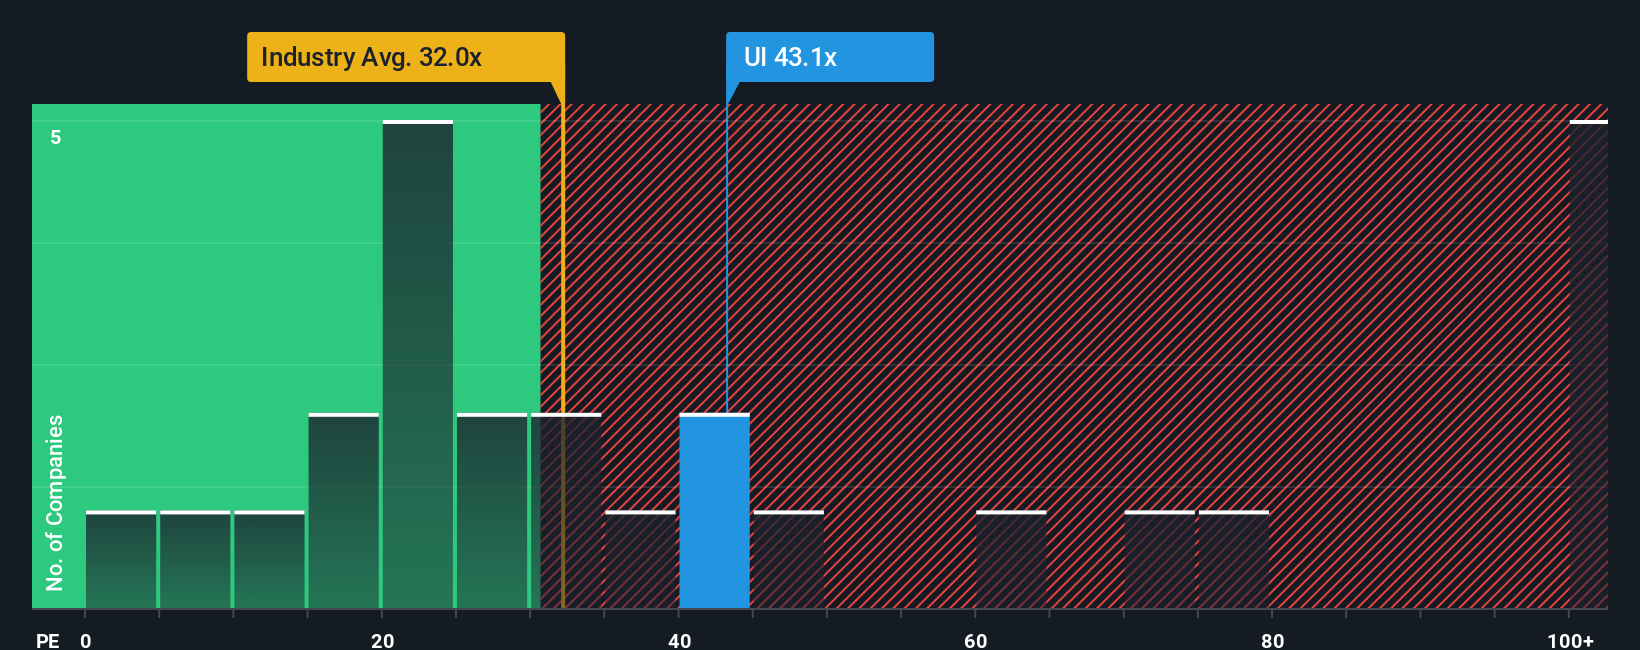
Ubiquiti currently trades on a P/E of 42.29x. That is above the Communications industry average P/E of 31.05x and also above the peer average of 32.95x. Simply Wall St’s Fair Ratio for Ubiquiti is 37.40x. This Fair Ratio is a proprietary estimate of what Ubiquiti’s P/E might be given its earnings growth profile, industry, profit margins, market cap and specific risks.
Because the Fair Ratio builds these company specific factors into a single benchmark, it can be more tailored than just comparing Ubiquiti with broad industry and peer averages. On this basis, Ubiquiti’s current P/E of 42.29x sits above its Fair Ratio of 37.40x, which suggests that the shares may be overvalued on an earnings basis.
Result: OVERVALUED
P/E ratios tell one story, but what if the real opportunity lies elsewhere? Discover 1440 companies where insiders are betting big on explosive growth.
Upgrade Your Decision Making: Choose your Ubiquiti Narrative
Earlier we mentioned that there is an even better way to understand valuation, so let us introduce you to Narratives, which are simply your own story about Ubiquiti that links what you believe about its products, competitive position and risks to a financial forecast and, ultimately, to a fair value per share.
On Simply Wall St, Narratives let you set assumptions for fair value, future revenue, earnings and margins, then see how that story compares with the current share price. This allows you to quickly judge whether Ubiquiti looks expensive or cheap against your own view instead of relying only on standard ratios.
Because Narratives sit inside the Community page on a platform used by millions of investors, they are designed to be quick to set up, easy to adjust and automatically updated when new information like news or earnings is added. This means your fair value view keeps moving with the latest data rather than staying frozen.
For Ubiquiti, one investor might build a Narrative with a relatively low fair value based on cautious assumptions, while another might set a much higher fair value based on more optimistic expectations about growth and profitability.
Do you think there's more to the story for Ubiquiti? Head over to our Community to see what others are saying!
This article by Simply Wall St is general in nature. We provide commentary based on historical data and analyst forecasts only using an unbiased methodology and our articles are not intended to be financial advice. It does not constitute a recommendation to buy or sell any stock, and does not take account of your objectives, or your financial situation. We aim to bring you long-term focused analysis driven by fundamental data. Note that our analysis may not factor in the latest price-sensitive company announcements or qualitative material. Simply Wall St has no position in any stocks mentioned.