Is It Too Late To Consider UL Solutions (ULS) After A 72% One-Year Rally?
UL Solutions Inc. Class A ULS | 84.60 | +0.04% |
- If you have been wondering whether UL Solutions is priced attractively right now, you are not alone. The stock has drawn attention from investors who are trying to work out what a fair value might look like.
- The share price last closed at US$84.38, with reported returns of 4.3% over the past week, 9.5% over the past month, and 72.5% over the past year. This naturally raises questions about what is already reflected in the price.
- Recent coverage has focused on UL Solutions as a newly listed testing, inspection, and certification company, with investors watching how it positions itself in areas such as safety and quality assurance for manufacturers and service providers. That backdrop, along with attention on how newer listings settle after coming to market, helps frame how investors are thinking about the current share price.
- Our valuation checks currently give UL Solutions a 0 out of 6 score. Next we will run through the usual valuation tools, then finish by looking at a more rounded way to think about what this price tag really means for you.
UL Solutions scores just 0/6 on our valuation checks. See what other red flags we found in the full valuation breakdown.
Approach 1: UL Solutions Discounted Cash Flow (DCF) Analysis
A Discounted Cash Flow, or DCF, model takes estimates of a company’s future cash flows and discounts them back to today using a required rate of return, to arrive at an estimated value per share.
For UL Solutions, the model used is a 2 Stage Free Cash Flow to Equity approach, based on cash flow projections. The latest twelve month Free Cash Flow is reported at about $359.4 million. Analyst inputs cover the nearer years, such as a projected $417.8 million in 2026 and $456.9 million in 2027. Simply Wall St then extrapolates further out, with projected Free Cash Flow of $896.98 million by 2035.
After discounting these cash flows back to today, the DCF model arrives at an estimated intrinsic value of about $75.57 per share. Compared with the recent share price of $84.38, this implies the stock is around 11.7% overvalued according to this approach.
Result: OVERVALUED
Our Discounted Cash Flow (DCF) analysis suggests UL Solutions may be overvalued by 11.7%. Discover 878 undervalued stocks or create your own screener to find better value opportunities.

Approach 2: UL Solutions Price vs Earnings
For profitable companies, the P/E ratio is a straightforward way to think about what you are paying for each dollar of earnings. It ties the share price directly to the business’s current profits, which many investors find easier to interpret than cash flow models.
What counts as a "normal" or "fair" P/E depends on how the market views a company’s growth prospects and risk. Higher expected growth or lower perceived risk can support a higher P/E, while slower growth or higher risk tends to align with a lower multiple.
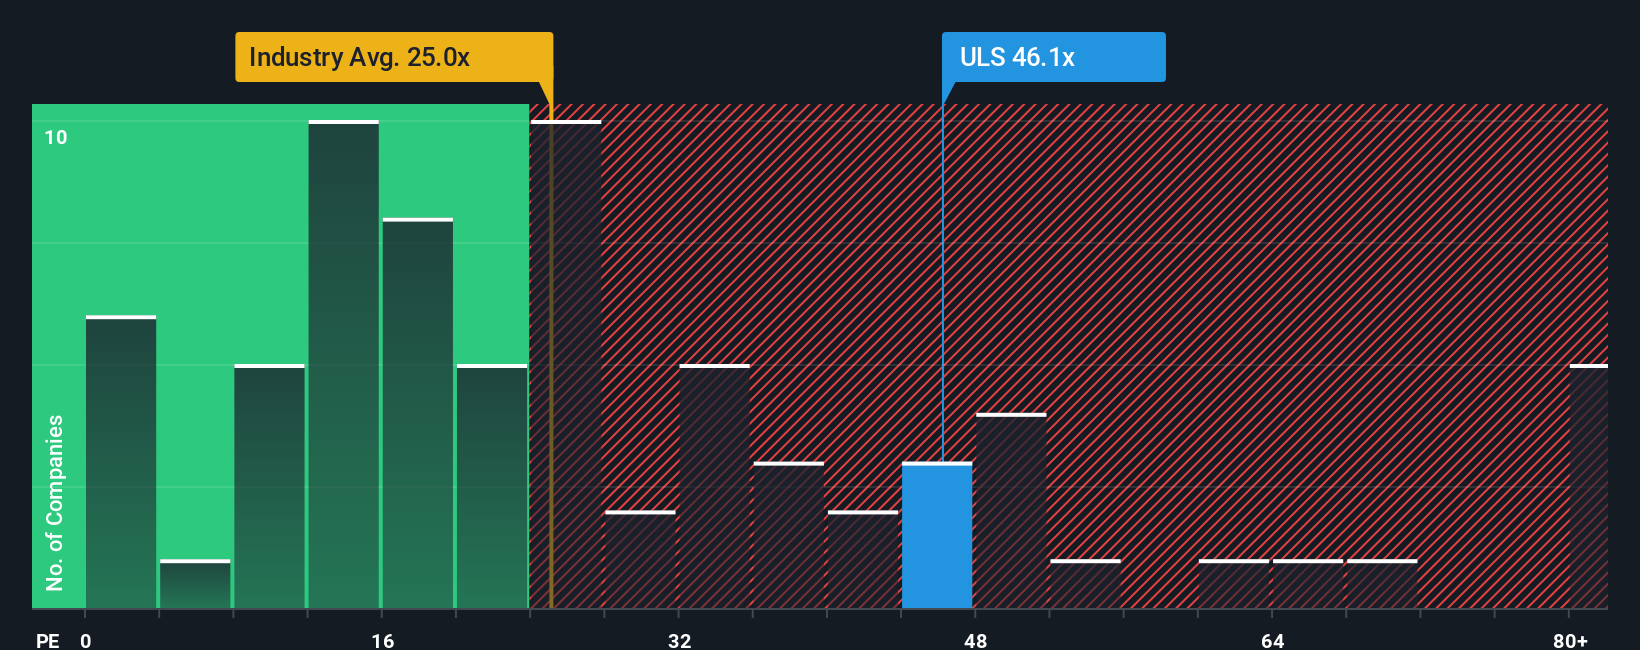
UL Solutions currently trades on a P/E of 53.15x, compared with an industry average of 25.09x for Professional Services and a peer average of 38.34x. Simply Wall St’s Fair Ratio for UL Solutions is 29.17x. The Fair Ratio is a proprietary estimate of what the P/E might look like after accounting for factors such as earnings growth profile, profit margins, industry, market cap and company specific risks. Because it blends these elements, it can be more tailored than a simple comparison with peers or the broad industry.
The current P/E of 53.15x sits noticeably above the Fair Ratio of 29.17x, which suggests that the shares screen as expensive on this metric.
Result: OVERVALUED
P/E ratios tell one story, but what if the real opportunity lies elsewhere? Discover 1441 companies where insiders are betting big on explosive growth.
Upgrade Your Decision Making: Choose your UL Solutions Narrative
Earlier we mentioned that there is an even better way to understand valuation. On Simply Wall St’s Community page you can use Narratives to connect your view of UL Solutions’ story to a set of revenue, earnings and margin forecasts, compare your resulting fair value to the current price to help you decide whether the stock looks appealing or not, and see how different investors can reasonably land on very different conclusions. For example, one Narrative might lean on index additions and an expanded testing network to support a fair value of about US$91.71 per share, while another might focus on higher capital expenditure, tax changes and macro risks to support a much lower view closer to US$59. Both Narratives automatically update as new news or earnings are added to the platform.
Do you think there's more to the story for UL Solutions? Head over to our Community to see what others are saying!

This article by Simply Wall St is general in nature. We provide commentary based on historical data and analyst forecasts only using an unbiased methodology and our articles are not intended to be financial advice. It does not constitute a recommendation to buy or sell any stock, and does not take account of your objectives, or your financial situation. We aim to bring you long-term focused analysis driven by fundamental data. Note that our analysis may not factor in the latest price-sensitive company announcements or qualitative material. Simply Wall St has no position in any stocks mentioned.